Basic MATLAB Practice
Table of contents
Overview
This page walks you through some practice exercises to help develop your MATLAB skills. It’s part of a series of MATLAB tutorials for ME 448/548:
Practice MATLAB Basics
We will use a simple MATLAB function to illustrate how input and output arguments allow a single program to solve a range of related problems. The benefits of using input and output parameters is self-evident, yet in years of teaching I have seen a near pathological resistance to learning how to write and use functions with input and output arguments. So, in an effort to break down that resistance, and to prepare you for using the analysis tools provided in the class, we’ll walk through a simple example.
1. Create a simple mfile to plot sin(x)
Open the MATLAB editor and enter these statements.
function myplot

x = linspace(0,2*pi);
y = sin(x);
plot(x,y)

end
Save this file as myplot.m in a folder called practice in your class MATLAB folder.
Run the program by typing myplot at the command prompt
>> myplot
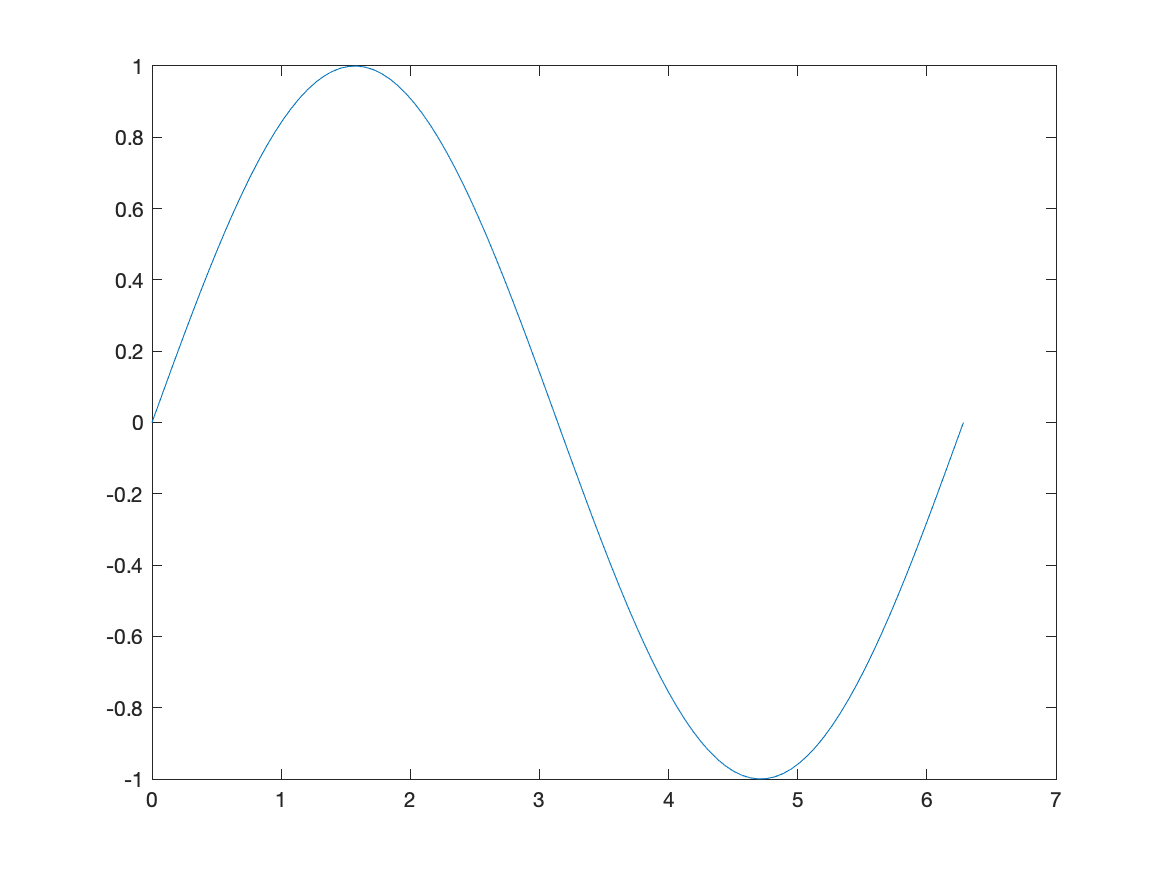
The result should be a new figure window, with a plot of a sine wave
2. Modify myplot to have two input arguments
Make myplot more general by providing xmin and xmax as inputs that define the range of x values used in the plot
Change the function definition line (first line of myplot.m) to
function myplot(xmin,xmax)
Change the linspace command in myplot.m to
x = linspace(xmin,xmax)
The modified code should now be
function myplot(xmin,xmax)

x = linspace(xmin,xmax);
y = sin(x);
plot(x,y)

end
Now if you run myplot from the command line
>> myplot
you get an error message because the input arguments are not defined. Try again, this time with two inputs
>> myplot(-2*pi, 3*pi)
Rerunning causes plot to be redrawn in the current figure window, which is likely to be hidden by the MATLAB command interface. You can select the figure window (to bring to the front). The recommended lazy way is to close all plot windows before running a new function that creates plot windows.
You can enter multiple commands on the same line as follows
>> close all; myplot(0,3*pi)
3. Modify myplot so that it supplies default input arguments
Add these lines before the linspace command
if nargin<1, xmin=0;    end
if nargin<2, xmax=2*pi; end
so now the complete function becomes The complete function should now look like this
function myplot(xmin,xmax)

if nargin<1, xmin=0; end
if nargin<2, xmax=2*pi; end

x = linspace(xmin,xmax);
y = sin(x);
plot(x,y)

end
Enter code as shown above, and test it with the following commands
>> close all;  myplot
>> close all;  myplot(-3*pi)
>> close all;  myplot(-pi, pi)
>> close all;  myplot(pi, -pi)
You can take the use of variable input arguments one step further by allowing for empty input arguments. Enter the following version of myplot
function myplot(xmin,xmax)

if nargin<1 || isempty(xmin), xmin=0;     end
if nargin<2 || isempty(xmax), xmax=2*pi;  end

x = linspace(xmin,xmax);
y = sin(x);
plot(x,y)

end
and test the code with the following commands
>> close all;  myplot([],5*pi)
>> close all;  myplot(-3*pi,[])