Debugging MATLAB Code
Table of contents
- Overview
- Introduction to debugging
- Plot .
- Introduce an error
- Old school debugging with
fprintfstatements - Use breakpoints in the debugger
- Debugger Summary
Overview
This page walks you through some practice exercises to help develop your MATLAB skills.
Introduction to debugging
This page builds on the previous examples to introduce debugging. Any substantial programming effort involves a lot of debugging. Using the built-in debugger will make that effort more productive.
In addition to the examples on the rest of the page, or maybe even before you work through those examples, I recommend the following YouTube videos that introduce the debugger
- MATLAB Debugging Tutorial (11 minutes) by Ilya Mikhelson
- Lesson 4.5: Debugging (25 minutes) from the 2015 version of the Coursera course, Introduction to programming with MATLAB.
Both of those videos give a good introduction to the debugger. You probably only need to watch one. The second one provides a bigger perspective on MATLAB programming, and I got a lot out of it while watching at 1.5x speed. :-)
Plot .
In order to practice debugging, we introduce an error in the myplot.m code. But first, we’ll change myplot so that it plots a different function.
Change the behavior of the function
Replace y = sin(x) with y = 1./sin(x). Note the dot operator.
function myplot(xmin,xmax)

if nargin<1 || isempty(xmin), xmin=0;    end
if nargin<2 || isempty(xmax), xmax=2*pi; end

x = linspace(xmin,xmax);
y = 1./sin(x);                  %   << Changed this line
plot(x,y)

end
Running the code to plot 1/sin(x) causes the plot to look funny because of the magnitude of at the points where .
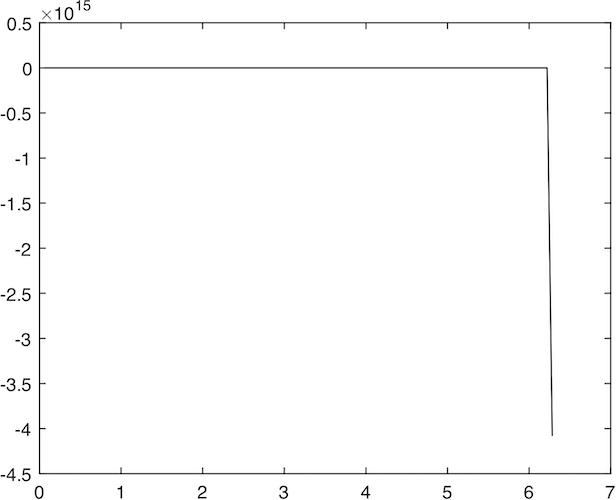
Rescale the y axis by enterring the following statement at the command line
>> ylim([-10, 10])
to produce the modified plot of
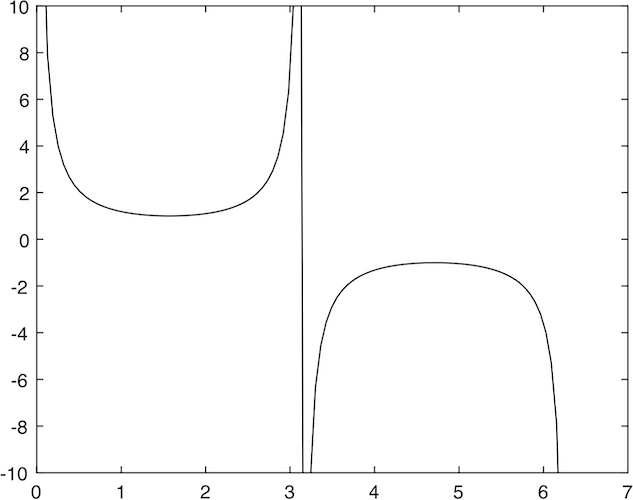
This plot is the function we wish to display. If creating the plot was our only goal, we would stop now.
Introduce an error
So far, there is nothing wrong with the code. I just wanted you to see the correct result. Now, change
y = 1./sin(x);
to
y = 1/sin(x);
which will cause a run-time error when you run the code.
A run-time error is an error that is only evident when the code is executed. In general, it is hard to see a run-time error just by looking at the code. The MATLAB syntax checker will not detect a runtime error. The most obvious problem with a run-time error is that the program crashes. However, not all runtime error cause a crash. Sometimes, a run-time error creates an erroneous numerical result.
A syntax error is caused by a violation of the programming syntax and will prevent the code from running.
In the current example,
y = 1/sin(x);is correct MATLAB syntax. Therefore, changingy = 1./sin(x);toy = 1/sin(x);does not prevent MATLAB from running the code. The error occurs when MATLAB evaluates the expression1/sin(x).The problem is not with the statement
1/sin(x)by itself. The problem is when that expression is evaluated whenxis a vector, not a scalar. In other words, the error occurs because of the data used by the running program. … But we’re getting ahead of ourselves.
For runtime errors – the error that only occurs when the code is running – there is often a gap between the line of code with the bug and the line of code that causes the program to crash. Therefore, an important part of debugging is isolating the section of code that contains the bug.
Old school debugging with fprintf statements
Let’s start with the old-school way of debugging.
I say “old school” because there was a time in the stone age of programming when debuggers were not yet invented, and the only way to probe for errors in your code was to add print statements. This old-school strategy is still useful, especially when you are monitoring a complex code that exhibits intermittent bugs.
Now, we know what the error is because we introduced the bug on purpose. For the sake of improving our debugging skills, we practice the art of bug hunting as if we didn’t know where in the code the error occurred and what caused the error. And remember, this example is so much simpler than the kind of hard debugging that takes lots of time, skill and patience.
In the following version of the myplot function, a single print statement is added before the x = linspace(xmin,xmax) statement.
function myplot(xmin,xmax)

if nargin<1 || isempty(xmin), xmin=0;    end
if nargin<2 || isempty(xmax), xmax=2*pi; end

fprintf('xmin, xmax = %f  %f\n',xmin,xmax);  % << Debugging print statement

x = linspace(xmin,xmax);
y = 1/sin(x);
plot(x,y)

end
We add the fprintf statement to make sure that the values of xmin and xmax are corretc.
Running this code we see that the error occurs after the fprintf statement. We also see that when myplot runs the values of xmin and xmax are as expected.
>> myplot
xmin, xmax = 0.000000  6.283185
Error using  /
Matrix dimensions must agree.
Error in myplot (line 9)
	y = 1/sin(x);
The message is that the error occurred on line 9, y = 1/sin(x). Again, we know that the error is in this line because we put it there. The key idea is to recognize that MATLAB stops where the program crashes. In this case, MATLAB also tells us the direct cause of the crash. With more difficult bugs, the location of the crash is often not the location of the bug.
To continue the locate-the-bug exercise, let’s add another fprintf statement after the creation of the x vector.
function myplot(xmin,xmax)

if nargin<1 || isempty(xmin), xmin=0;    end
if nargin<2 || isempty(xmax), xmax=2*pi; end

fprintf('xmin, xmax = %f  %f\n',xmin,xmax);  % << Debugging print statement

x = linspace(xmin,xmax);

fprintf('size(x) = %d  %d\n',size(x));   % << Another debugging print statement

y = 1/sin(x);
plot(x,y)

end
Running the modified code gives this result
>> myplot
xmin, xmax = 0.000000  6.283185
size(x) = 1  100
Error using  /
Matrix dimensions must agree.
Error in myplot (line 12)
	y = 1/sin(x);
This confirms that there is no problem with the creation of x.
The key idea of the preceding exercise is that we narrowed down the location of the bug by confirming that statements leading up to the error are not the problem.
Use breakpoints in the debugger
The old-school debugging exercise has shown us that the statements up until the y = 1/sin(x) are not the problem. Those statements are producing the correct result.
Now we show how to use the debugger to repeat the detective work. We start with the original myplot function without the fprintf statements.
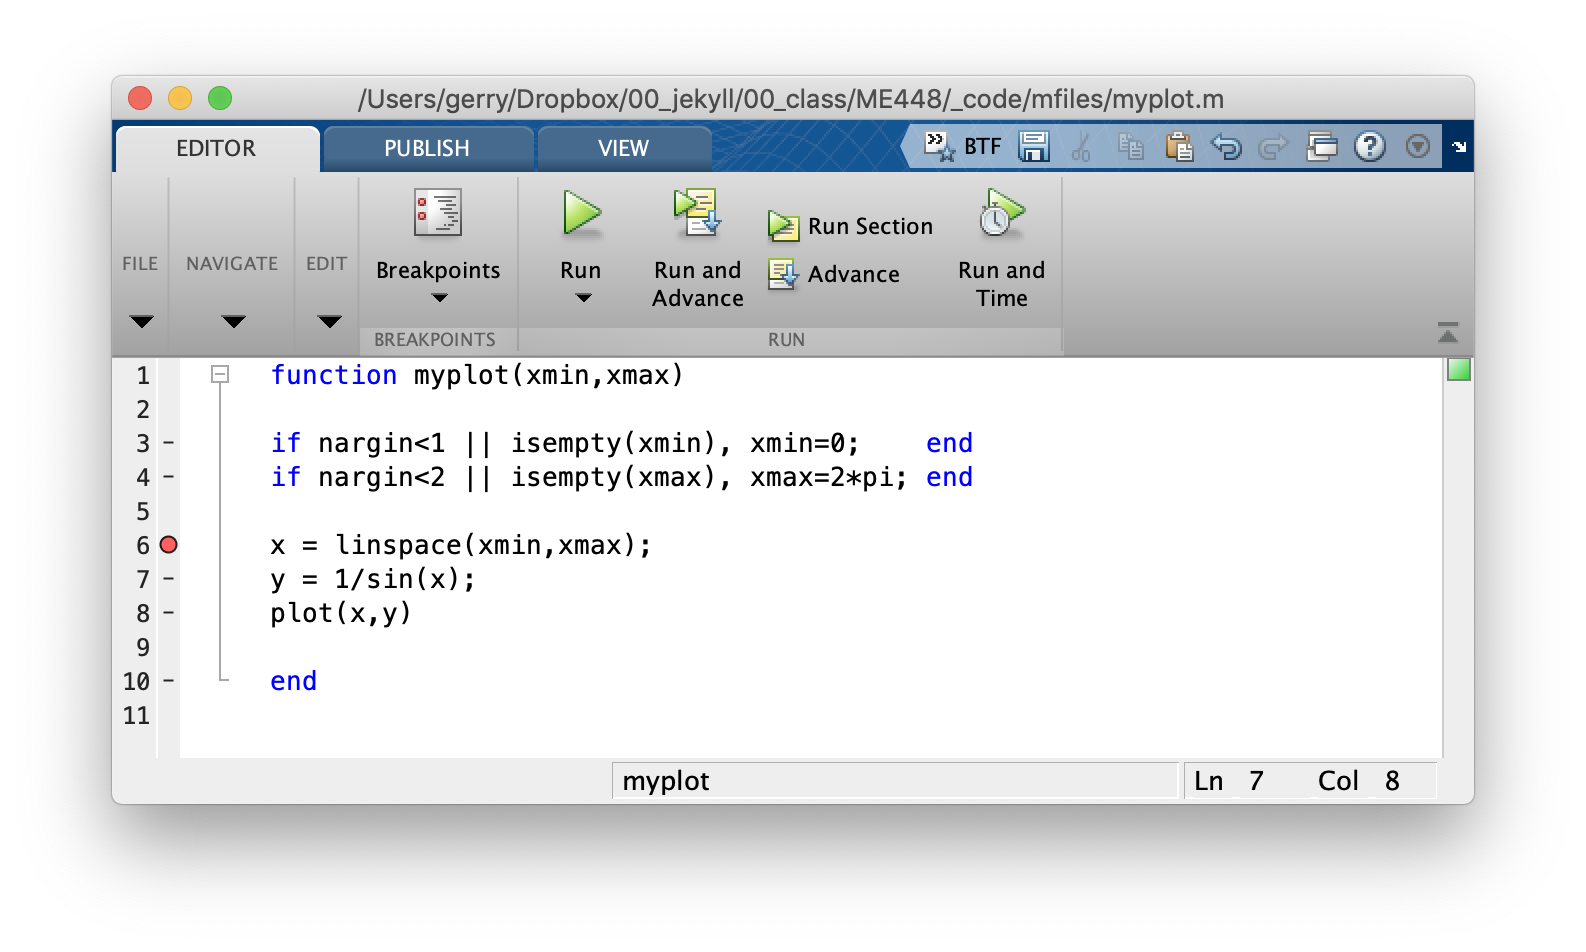
In the code editor window, click on the dash to the left of line 6, `x = linspace(xmin,xmax)’. The dash turns into a red dot, which indicates that you have started the debugger.
Running the code causes the execution to halt before the statement with the breakpoint. MATLAB indicates the location with a green arrow.
Also notice that the ribbon at the top of the code editor now has icons for Continue, Step, Step In, Step Out, Run to Cursor and Quit Debugging, which are all used to control the debugger.

Clicking the Step icon at the top of the editor pane causes the x = linspace(xmin,xmax) statement to be executed and the green arrow to advance to the next line.
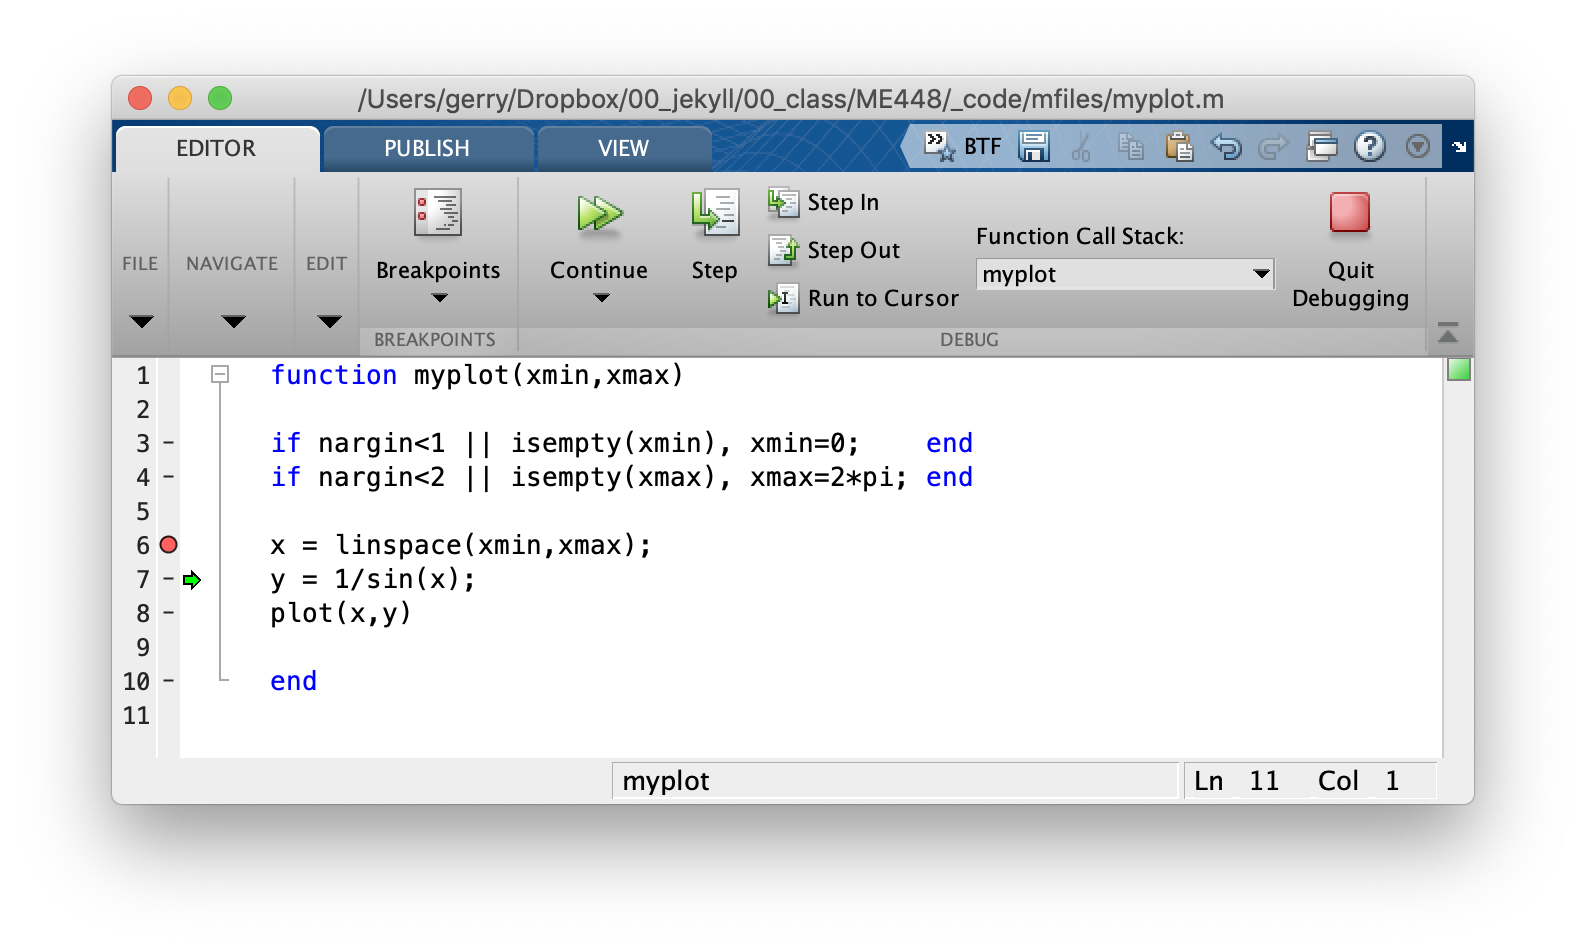
Before clicking Step icon again, look at the Workspace pane. The value of xmin and xmax are displayed, along with the size of x.
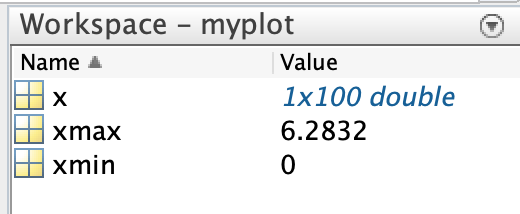
The workspace pane displays the same information that we used to discover with the old-school fprintf statements.
Clicking Next again will cause the debugger to execute line 8, which results in the run-time error.
Debugger Summary
The preceding demonstration is just a preview of what is possible with the debugger. I recommend that you watch one or both of these YouTube tutorials:
- MATLAB Debugging Tutorial (11 minutes) by Ilya Mikhelson
- Lesson 4.5: Debugging (25 minutes) from the 2015 version of the Coursera course, Introduction to programming with MATLAB.