-
Profiles enables you to load, create, save and delete mission profiles.
-
Edit enables you to make changes to a profile.
-
Graph enables you to view information graphs.
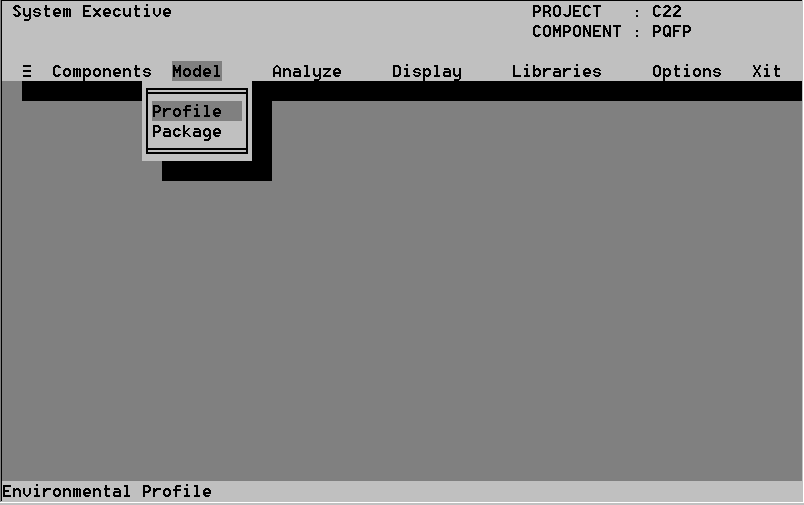
6.2.3 The Profiles Option
The Profiles menu contains four commands:
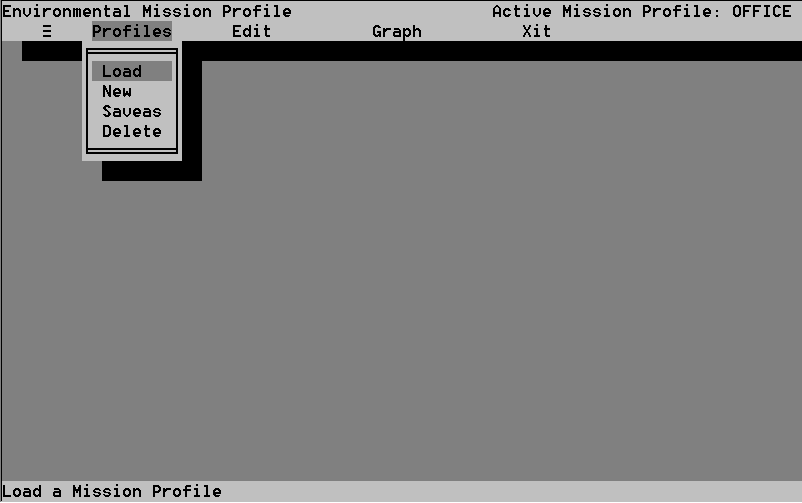 Figure 2. The profiles menu
-
Load lets you activate an existing mission profile.
-
New lets you create new mission profiles.
-
Saveas lets you duplicate existing mission profiles.
-
Delete lets you discard mission profiles.
6.2.3.1 The Load
Command
Use the Load command to activate a mission profile.
-
Select the Load command from the Profiles option header
menu. A window listing all the existing mission profiles appears (see Figure
3).
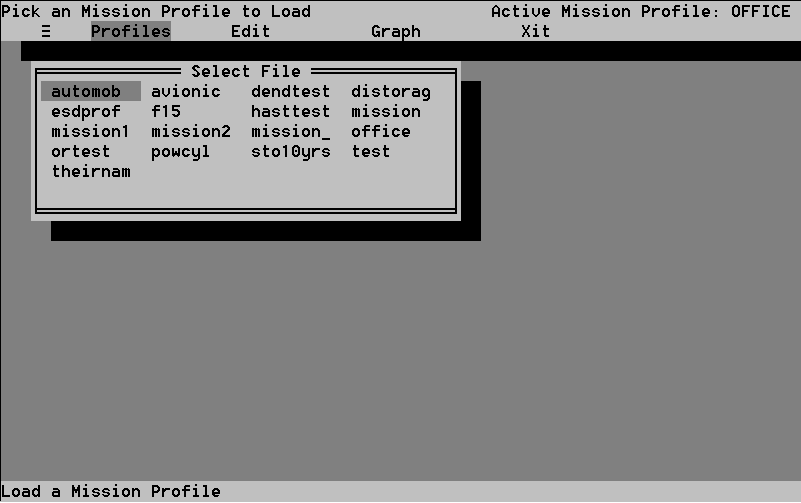 Figure 3. The Load command selection window
-
Select a profile. You return to the Mission Profile screen. The
active mission profile file name appears in the upper right of the top
menu bar.
6.2.3.2 The
New Command
Use New to create new mission profile files.
-
Select the New command from the Profiles option header
menu. A New File Name box appears in the bottom portion of the screen (see
Figure 4).
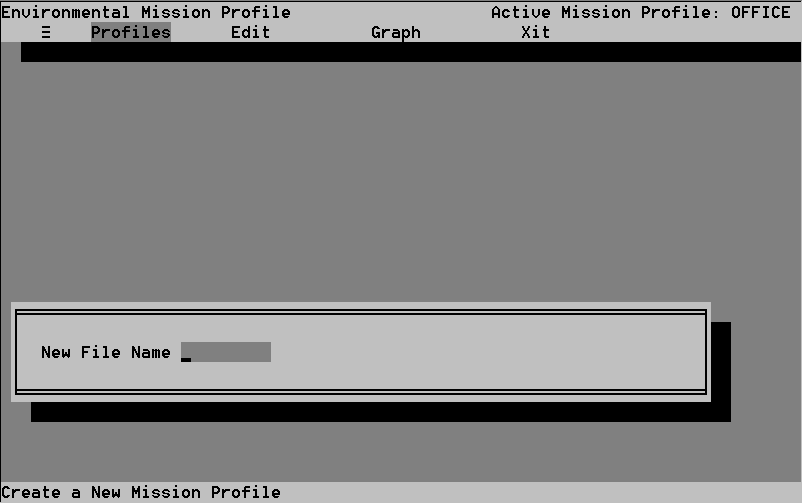 Figure 4. The New command new file entry window
-
Type a file name. Click on the new name or press Enter to activate
it. The name of the new file appears in the upper right corner of the top
level menu bar.
Proceed to Section 6.2.4.2, and add environments or stress conditions to
the newly created file. You cannot add environments or stress conditions
from the New window.
6.2.3.3 The
Saveas Command
Use Saveas to duplicate an active profile. You can then modify
the new file to create a new, similar environment for your package.
-
Select the Saveas command from the Profiles option
header menu. Make sure the profile which is to be duplicated is active.
A box appears, asking you to name the duplicate.
-
Type the new name. Press Enter or click on it with the mouse.
-
The newly named file becomes active, and its name appears in the upper
right corner of the top level menu bar. The old file is no longer active,
but is not overwritten.
Saveas does not work when the active file has no data in it. Instead,
this error message appears: File renamed but there is no data to save.
6.2.3.4 The
Delete Command
Use Delete to delete profiles. The active profile cannot be
deleted.c
-
Select the Delete command from the Profiles option
header menu. A list of profiles appears.
-
Select the profile you want to delete. Press Enter or click
on it with the mouse.
-
A message appears asking you to confirm the deletion (see Figure 5). Select
Yes to confirm, No to cancel and return to the Mission Profile screen.
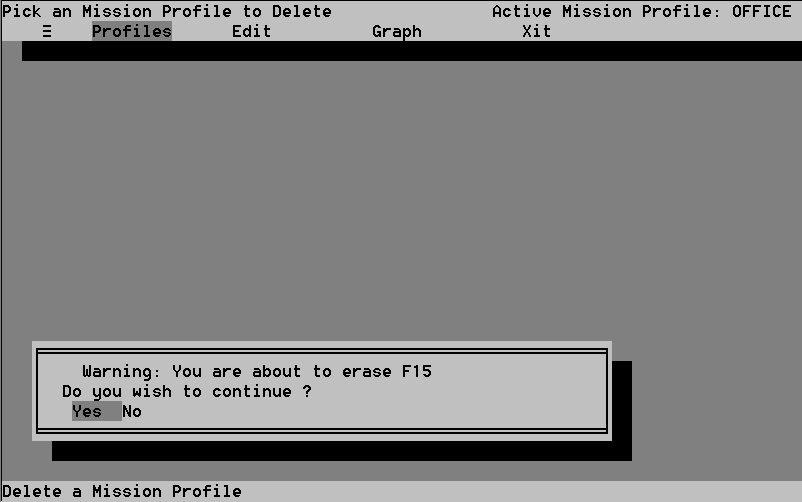 Figure 5. The Delete confirmation window
Attempting to delete the active profile produces an error message. Activate
a different profile and then select the previously active profile for deletion.
6.2.4 The Edit
Option
The Edit option in Mission Profile enables you
to specify environments and stress conditions for both new and old profiles.
Operation/transportation/storage environments are stored in the Environments
Library, test and screening conditions in the Test/Screen Library.
The Edit option header menu contains three commands (see Figure
6):
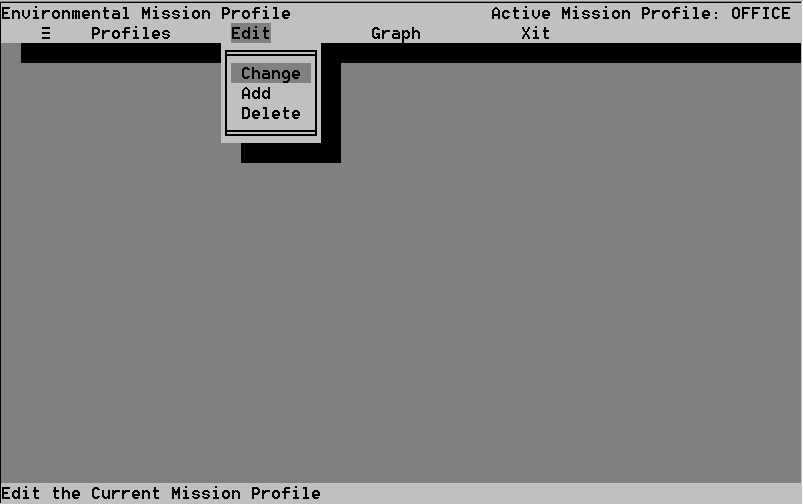 Figure 6. The Edit option menu
-
Change enables you to replace environments and stress conditions
with others, change the duration assigned and environment or stress condition,
and specify their repeats.
-
Add enables you to specify environments and stress conditions from
the mission profile.
-
Delete enables you to delete environments and stress conditions
from the mission profile.
6.2.4.1 The Change
Command
-
Select the Change command from the Edit option header menu.
An Edit window appears. The active profile name appears in the upper right
corner (see Figure 7). In this window you can group or replace environments
or stress conditions (listed as E or S, respectively, in the Envir. Type
category), view their parameters and APSD graphs, and adjust mission time,
as explained on the next page. If there is no data in the mission profile,
an error message appears.
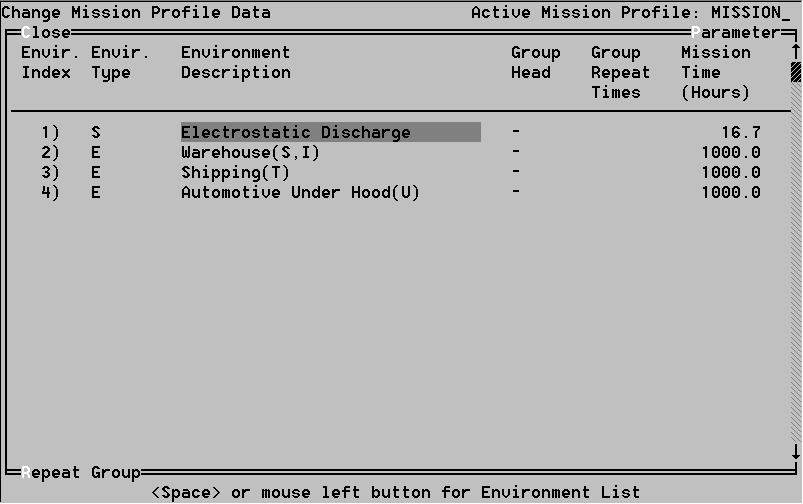 Figure 7. The Mission Profile Data window
Grouping Environments
When a device experiences environment(s) cyclically, you must group
the environment(s), and specify the number of repeats (the Group Repeat
time below).
-
In the Change Mission Profile window, select any field in the environment
or stress condition you want in the group. Then select the Repeat
Group hot key. The Group Head field changes from - to G, the Group
Repeat Time is assigned a value of 2, and the Mission Time field turns
blue (see Figure 8).
 Figure 8. Grouping environments
-
To change the number of group repeats, select the Group Repeat Time field,
and type a new number.
-
To ungroup an environment or stress condition, select any field. Then select
the Repeat Group hot key. The grouping field changes from G to -,
the repeat field goes blank, and the blue
color disappears.
Replacing Environments and Stress Conditions
When you replace environments or stress conditions, you exchange one
for another. Use this method to place one last in the list.
-
In the Edit window, select the environment or stress condition you
want to replace and press the Space bar. A list of environments
or stress conditions appears. To view a description of any environment
or stress condition, select it and press F1. To view parameters,
select the Parameters hot key. See "Viewing Parameters and
APSD Graphs" below.
-
Select the replacement environment or stress condition and press
Enter. You return to the Edit window, where the replacement appears.
The environment type field will change to E or S for environment
or stress condition, respectively.
Viewing Parameters and APSD Graphs
-
In the Edit window, select the environment or stress condition.
Then select the Parameters hot key. A read-only parameters
window appears (see Figure 9). Press Esc to exit.
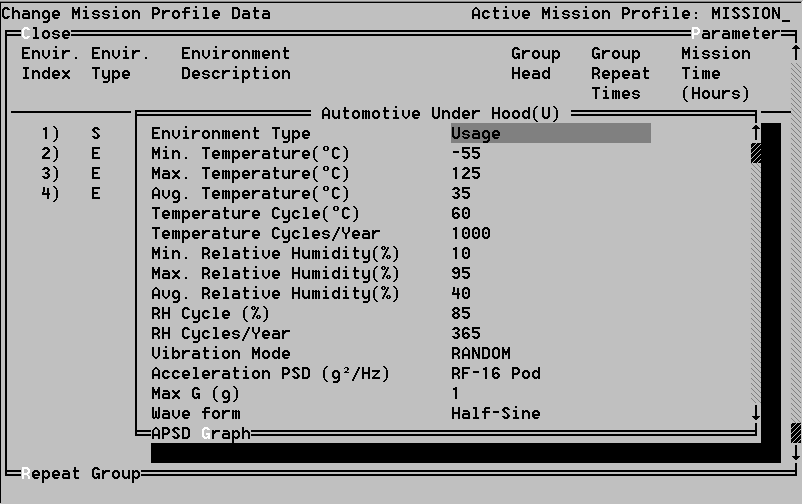 Figure 9. The View Parameters Window
-
To view an APSD graph, select the APSD hot key. The graph
appears (see Figure 10). Press Esc to exit.
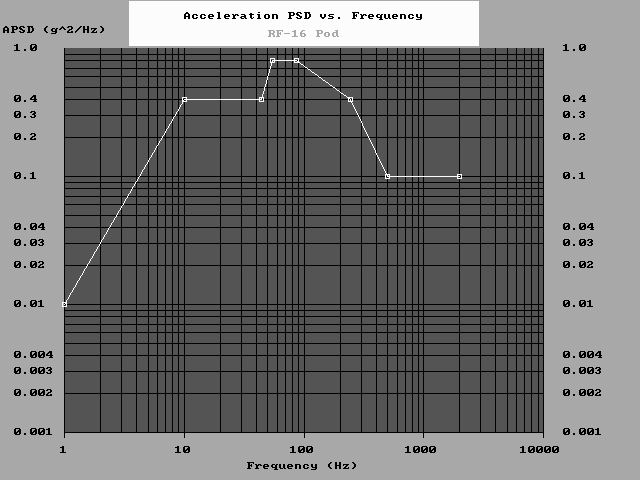 Figure 10. An ASPD Graph
Change Mission Time
Select the time to be changed. Type the number of hours the device
will experience the environment and press Enter.
6.2.4.2 The
Add Command
Use Add to include an environment or stress condition and its
duration in a mission profile.
-
Select the Add command from the Edit option header menu.
An Add Environments window appears listing five things: The environmental/stress
index number, environmental/stress file name, environmental type, environment
description, and the mission duration time (see Figure 11). The index number,
which determines what order the environments appear in the profile, cannot
be changed. The file name appears after you select an environment or stress
condition for addition.
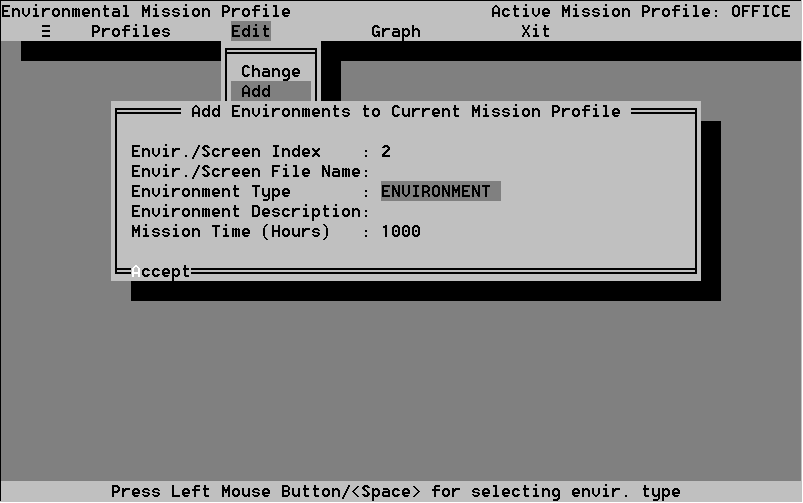 Figure 11. The Add command dialogue window
-
The Environment Type field is highlighted. Press the Space bar to
toggle between Environment and Stress. Press Return
to select one of the two. The highlighter moves to the Environment
Description field.
-
Press the Space bar. A list of all available environments or stress
conditions appears. You can view their parameters with the Parameters
hot key in the lower left corner of the window. The Parameters window is
view only. You can view any ASPD graph by selecting the ASPD hot
key. Press Esc to return to the Add Environments window.
-
Select and environment of stress condition to add to the mission
profile and press Enter to return to the Add Environments window.
The file name and description of the chosen environment appears (see Figure
12).
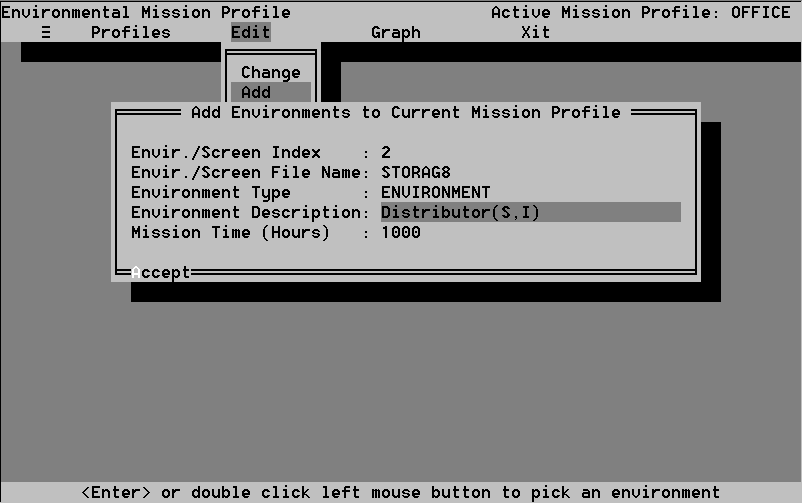 Figure 12. After selecting environment
-
If you want to change the mission time, select the Mission Time
field and type a new time.
-
To add the environment to the mission profile, select the Accept
hot key. Press Esc to cancel.
-
Repeat Steps 1-6 to add more environments or stress conditions to the mission
profile.
6.2.4.3 The Delete Command
Use Add and Delete in tandem to adjust the order of the
environments and stress conditions in the profile.
-
Select the Delete command from the Edit option header menu.
The Edit window in Figure 13 appears.
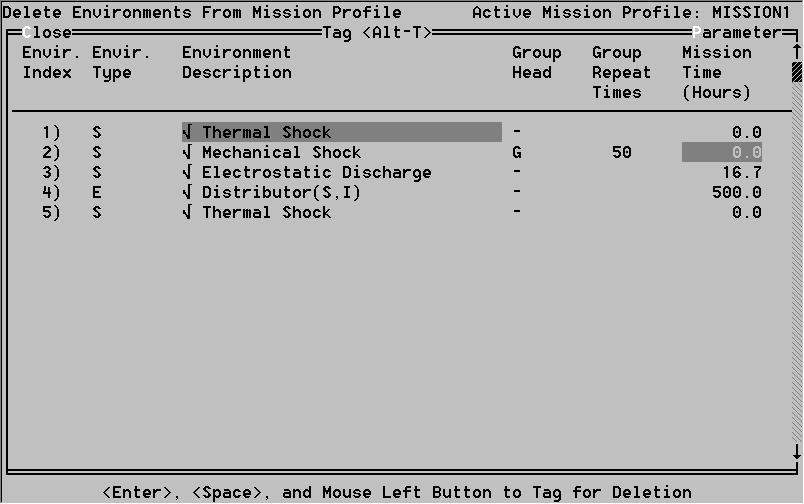 Figure 13. Tagging for deletion
-
An environment must be tagged before it can be deleted. To tag an
environment, highlight it and press the left mouse button or press Enter.
A check mark appears next to the environment, indicating it is tagged (see
Figure 13). Untag a tagged environment using the same procedure.
-
To delete the tagged environment, select Close. Press Esc
to cancel. A window asks you to confirm. Select Yes to confirm,
No to cancel and return to the Mission Profile screen.
6.2.5 The Graph
Option
Use the Graph option header to view graphs displaying certain
mission profile characteristics. Each graph plots various parameters against
time. The graphs enable you to avoid having to view the environment parameters
separately.
-
Select the Graph option from the Mission Profile screen.
The Graph option header menu appears (see Figure 14). Three types of graphs
may be viewed:
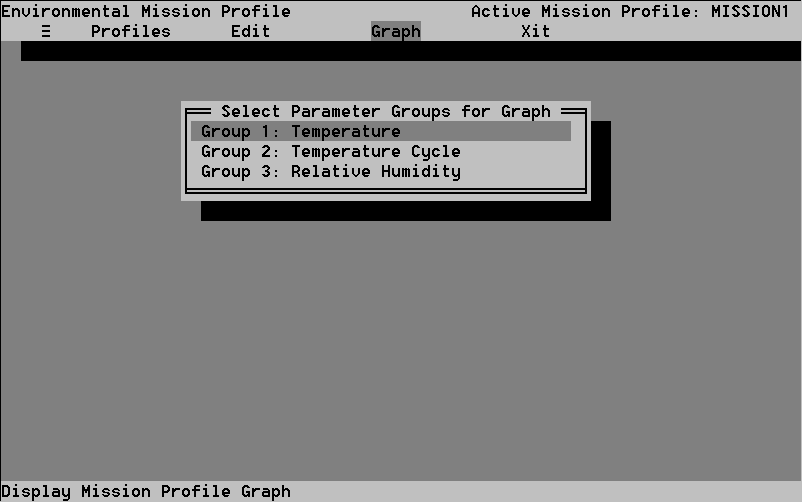 Figure 14. The Graph option menu
-
Temperature plots the minimum, maximum, and average temperature.
-
Temperature Cycle plots only the temperature cycle.
-
Relative Humidity plots the minimum, maximum, and average relative
humidity (RH) and the RH cycle