- Components enables you to activate, create, copy, or delete projects.
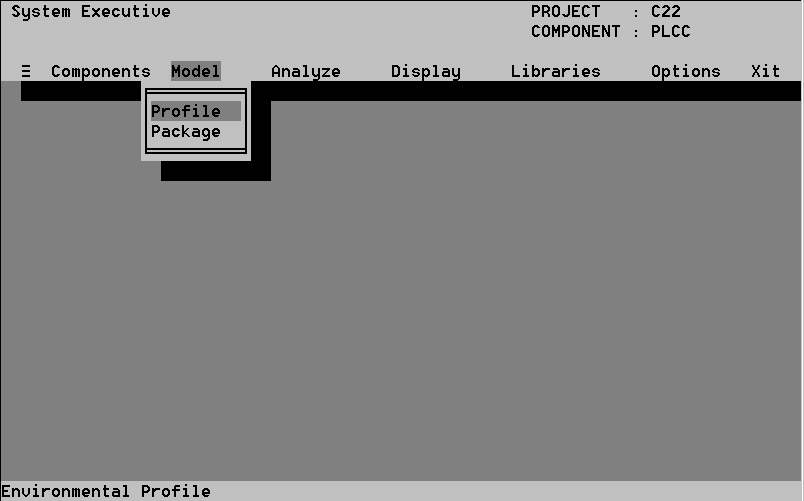
- Model enables you to model components and mission profiles.
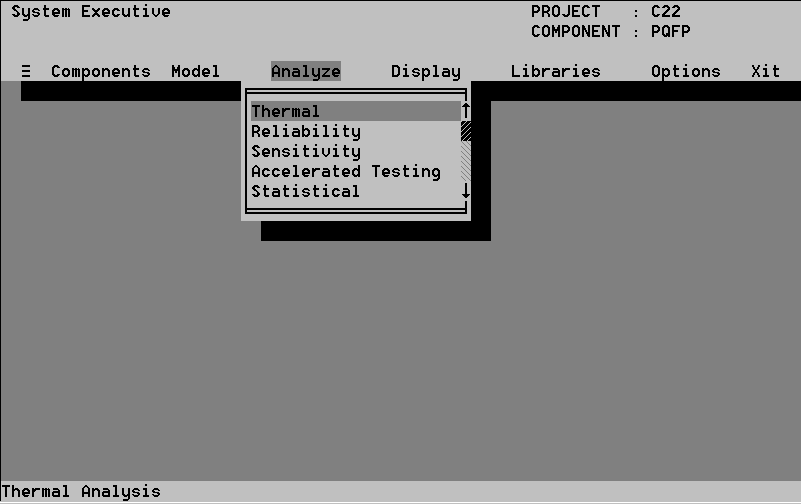
- Analyze enables you to perform thermal, reliability, sensitivity, and accelerated testing analyses.
- Display enables you to view a special thermal analysis display and to view, edit, and print reports and graphs.
- Libraries enables you to view and edit material, environment, test/stress, PSD curve, failure mechanism, and interconnect databases.
- Options enables you to select the working directories, insert or delete menu options.
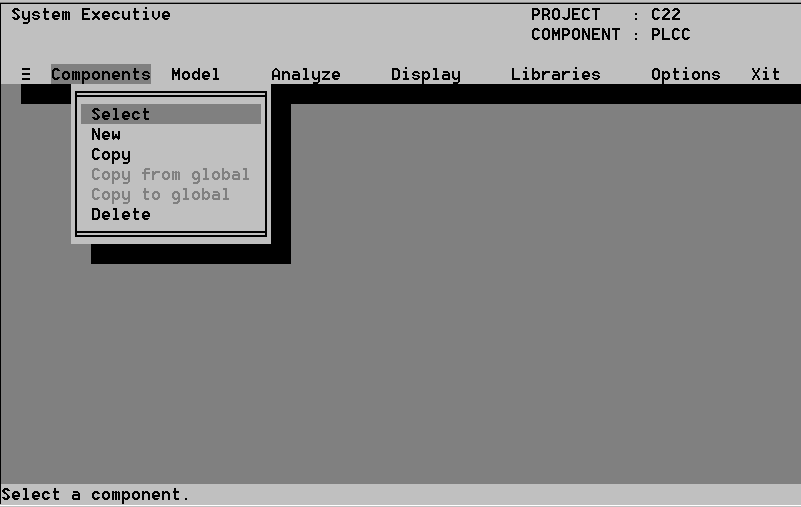
- Select enables you to activate a project.
- New enables you to create a component.
- Copy enables you to copy and rename a component.
- Copy from enables you to bring a global component into the local directory.
- Copy to enables you to copy a local component to the global directory.
- Delete enables you to delete components.
- Profile enables you to load the mission profile of the package
- Package enables you to design the package.
- Profiles enables you to load, save, delete, or start a new environmental mission profile.
- Edit allows you to change existing profiles as well as add or delete multiple environments from the current profile.
- Graph enables you to view the changes in temperature, temperature cycle, or relative humidity for the profile.
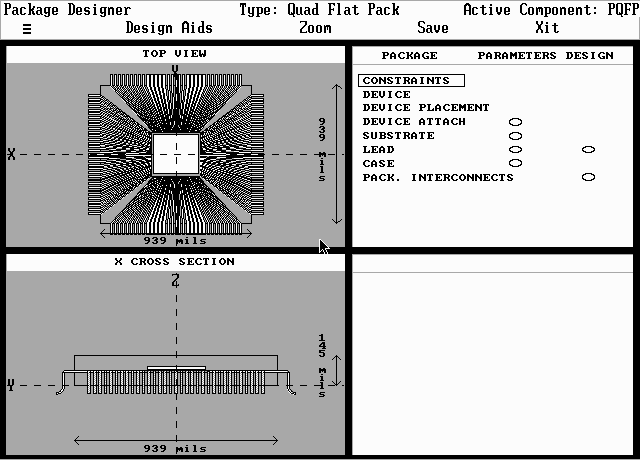
- Design Aids helps you to choose an interconnect, substrate, mounting technology and package type.
- Zoom enables you to view enlarged package views.
- Save enables you to periodically save your design.
- Thermal enables you to perform conduction and conduction/convection thermal analyses.
- Reliability enables you to estimate the package reliability.
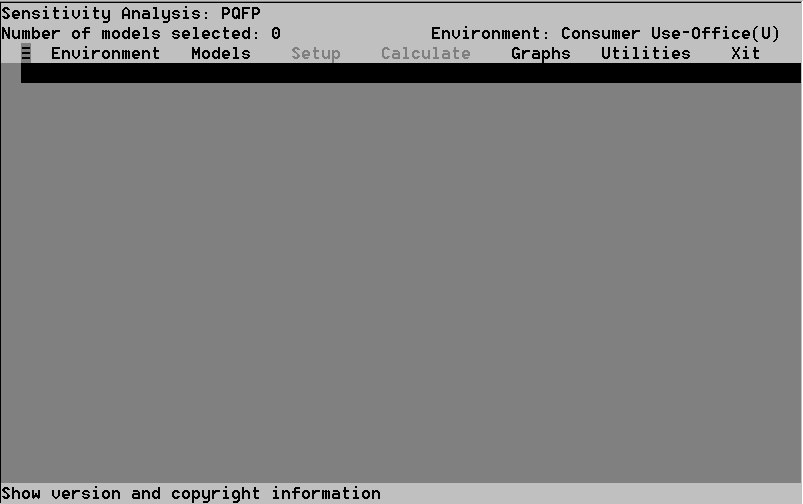
- Sensitivity enables you to perform a sensitivity analysis on the package attributes.
- Accelerated Testing enables you to run the accelerated testing calculations for multiple failure modes and stresses.
- Statistical represents a sample program explained in Section 4.6 .
- Boundary enables you to assign boundary conditions.
- Parameters enables you to vary factors that will influence the calculation, such as the convergence factor.
- Analyze performs the thermal analysis.
- Environment allows you to select the active environment
- Select provides a list of all available failure mechanisms from which you select the models to be analyzed.
- Analyze invokes the calculations.
- Display enables you to view a results summary, the complete calculation results, the error log, and the screened models log.
- Utilities provides access to the Report Manager and the Attribute Editor.
- Environment same as above
- Models provides a list of all available failure mechanisms from which you select the models to be analyzed.
- Setup allows you to select the type of analysis (function curve, sensitivity) and the attributes and parameters to be used in the derating analysis.
- Calculate invokes the calculations.
- Graphs enables you to view the results.
- Utilities permits you to view the error logs and access the Attribute Editor.
- Environment same as above
- Select enables you to select the failure modes and stresses which you wish to use to conduct the accelerated testing analysis.
- Setup allows you to select the type of analysis (function curve, sensitivity) and the attributes and parameters to be used in the derating analysis.
- Calculate invokes the calculations.
- Graphs enables you to view the results.
- 4
Overview of the System Executive
This chapter provides an overview of the System Executive and each of the options in its top-level menu. Detailed instructions for operating the options are provided in Chapters 5-8.
The System Executive displays the
name of the active project and the component being designed in the upper
right corner of the top-level menu. (See Figure 1.) When you first log
on to CADMP-II, the project that was active when you last logged off appears
by default.
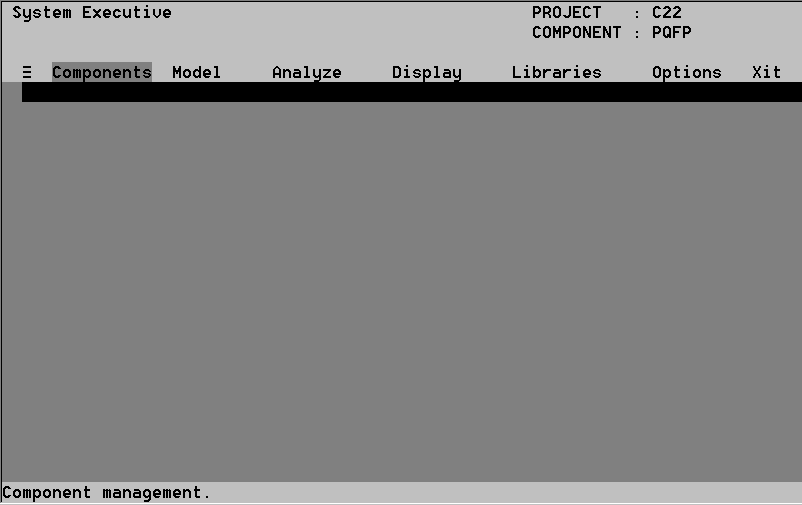
The System Executive options are:
4.1 The Components Option
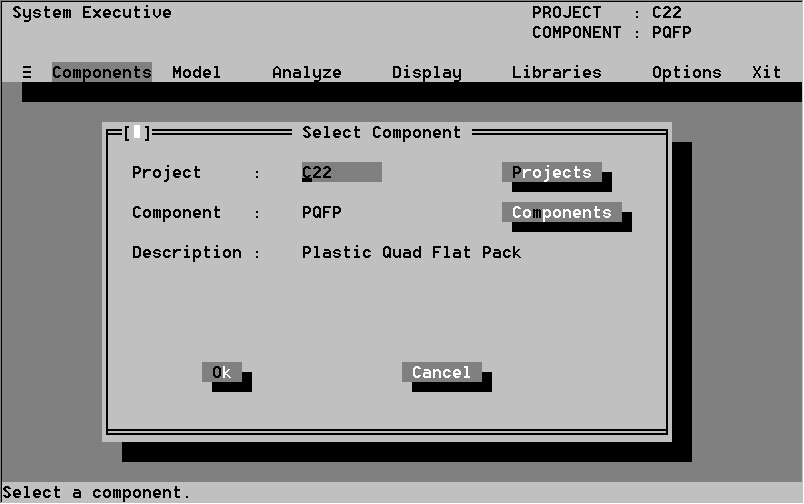
The Components menu contains six commands (see Figure 2). Selecting these commands displays the Select Components window in Figure 3. The operation of this option is discussed in further detail in Chapter 5.
The Model option enables you to design a package and its interconnects. These tools are discussed in further detail in Chapter 6. The menu contains two commands (see Figure 4):
These commands have their own interfaces, as shown in Figures 5 and 6.
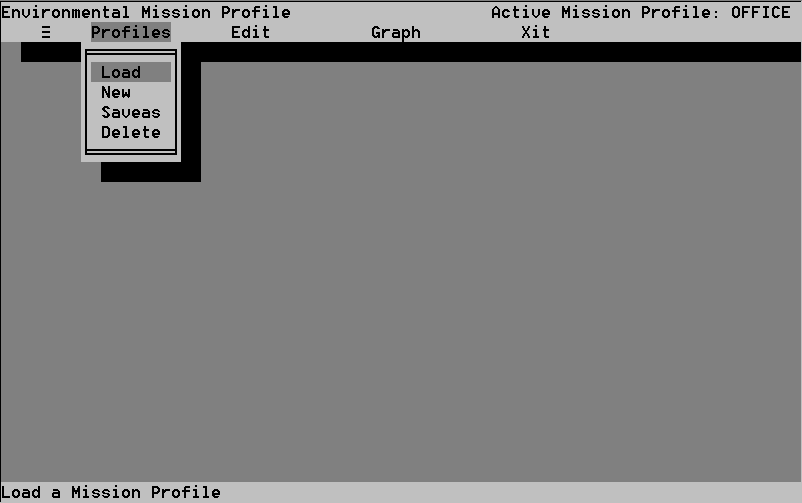
4.2.1 The Environment Profile Screen
The Profile screen is shown in Figure
5. The top level menu contains:
The Package graphical interface in Figure 6 has three options in its top-level menu:
The Analyze option contains four commands (see Figure 7), all of which are discussed in detail in Chapter 7.
4.3.1 The Thermal Interactive Graphics Display
Figure 8 shows the Thermal interactive graphics display. You use the grid and commands in the Boundary menu to assign boundary conditions before running the analysis.
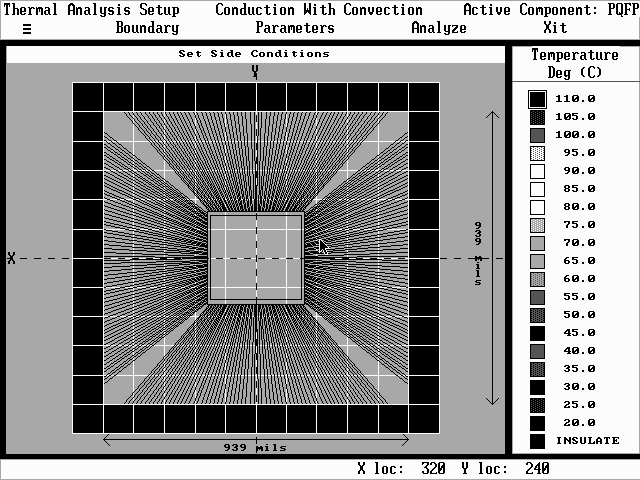
Figure 9 shows the Reliability Analysis main menu. Notice that there are five options:

The Derating menu can be seen in Figure 10. It contains six options:
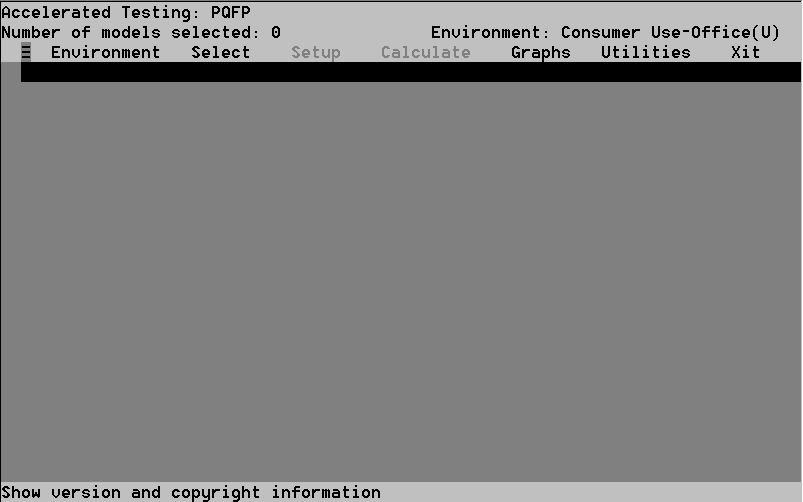
The Accelerated Testing menu can be seen in Figure 11. It also contains six options:
