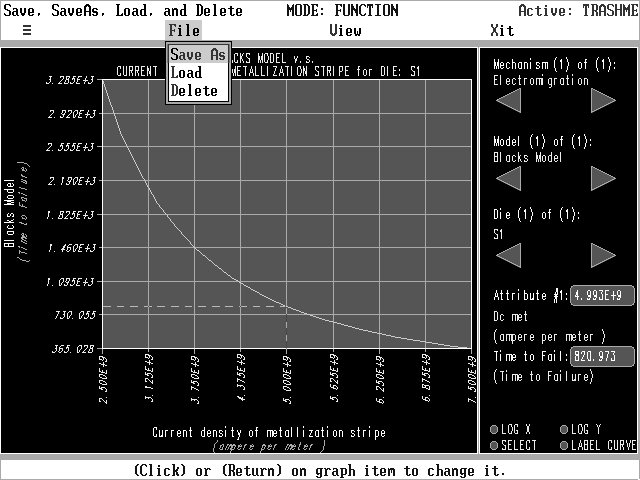
- File enables you to save, load, and delete graphs.
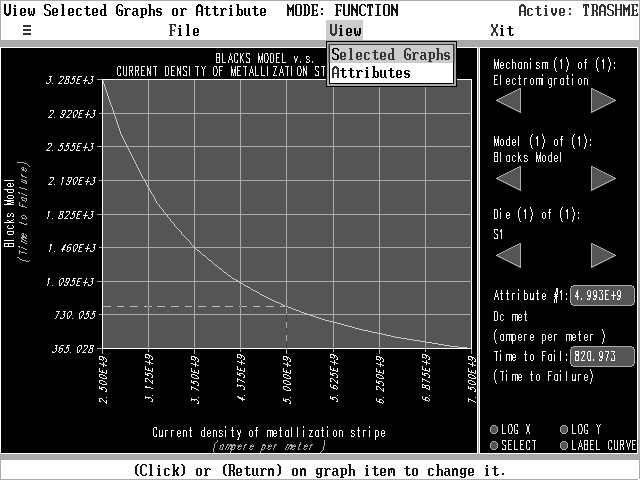
- View enables you to view multiple curves and to see the attribute values of the package.
- Save As enables you to save a graph and specify the filename.
- Load enables you to load a saved graph.
- Delete enables you to erase unwanted graphs.
- Selected Graphs which allows you to view all of the curves for which you have activated the SELECT toggle button in the lower right of the DGM screen.
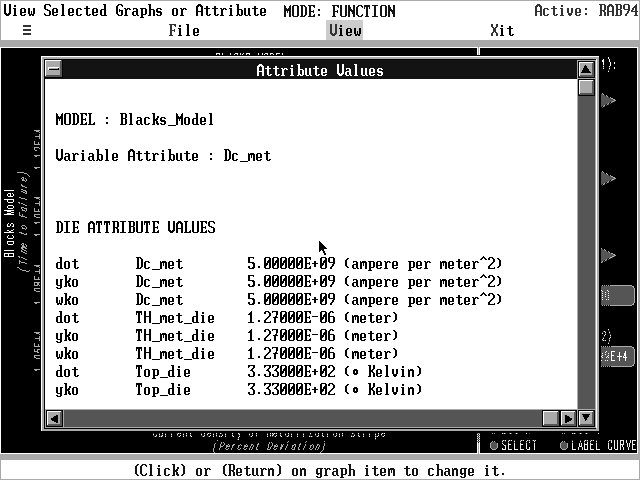
- Attributes enables you to view the attribute values of your package.
- Attributes enables you to quickly change package and environment parameter values, see Section 7.2.2.4.2.
- Error Log enables you to view calculation errors, see Section 7.2.2.4.3.
- Screen Log displays the screened out models, see Section 7.2.2.4.
- 7.3.2.4 The Graph Option
The Graph option enables you to view the function and derating curves. When you select Graph the Derating Graph Manager (DGM) is loaded. The Current graph, that is generated by the calculations you just performed, will automatically appear. If you have not performed any calculations, you may still enter the DGM. Upon loading it will ask you to load a previously saved graph. If there are none of these then you will not be allowed to enter the graphing tool. You may also enter the graph manager by selecting graph under display in the main menu.
The DGM is capable of creating presentation-quality graphs very easily. Looking at Figure 50 you will see that the right hand side of the screen lists the failure mechanism, the model, and the die. There is a left and a right arrow located under each of these. Clicking on these arrows allows you to flip between graphs if you have more than one. For instance if you have more than one die and wish to see the function curve for the second die, simply click on the right arrow and the other die's results will appear. Click the left arrow to return to the first die.

Below the arrows there are two boxes which display the value of the x- and y-axis parameters at the point indicated by the dotted lines extending from the axes on the graph. The dotted lines can be moved by grabbing them with the mouse (clicking on them with left button) and dragging them up or down the curve. Notice that the values in the boxes change accordingly.
At the bottom right of the screen there are four toggle switches: LOG X, LOG Y, SELECT, and LABEL CURVE. These buttons are toggled by clicking on the circle directly to the left of the text. Note that when the circle is filled with white then that option is active. Click on the circle again to deactivate, and it will return to gray. LOG X and LOG Y enable you to change the scale of the x- or y-axis to log. Activating SELECT will indicate that you wish this curve to appear when you view multiple graphs by selecting Selected Graphs from the View menu option. This is discussed in further detail in Section 7.3.7.2. Activating LABEL CURVE will apply a label in the graph area to the curve currently displayed there (see Figure 51). This label can be moved by clicking once on the text with the left mouse button, dragging it to where you want it to be, and pressing the left button again.
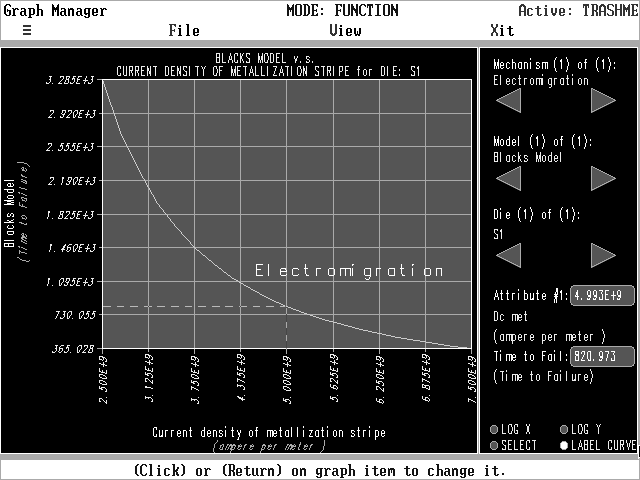
It can be changed when you change the text of graph title. The text on the graph itself is simple to edit. Simply click, with the left mouse button, on the item you wish to change. A window will appear where you can alter the text. You can change the title, x- and y-axis labels, and the format and range of the axis ticks. When you click on the either axes' ticks the window shown in Figure 52 appears.
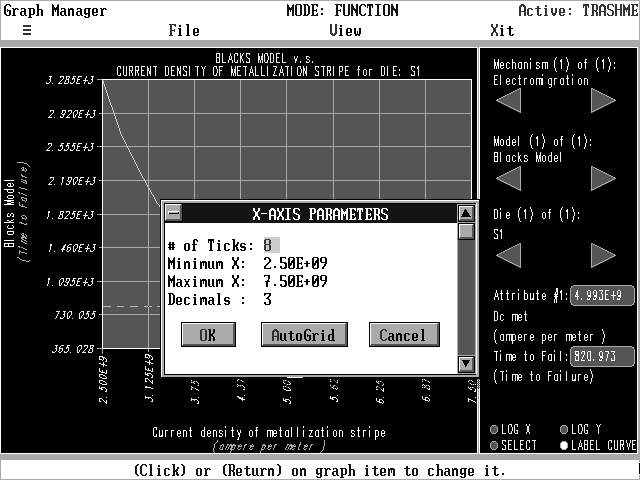
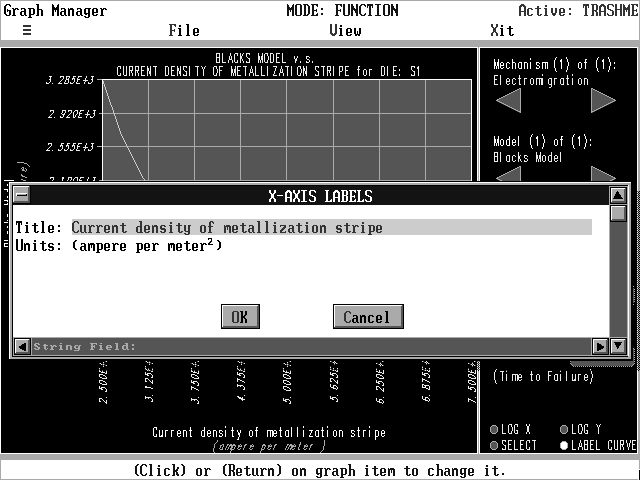
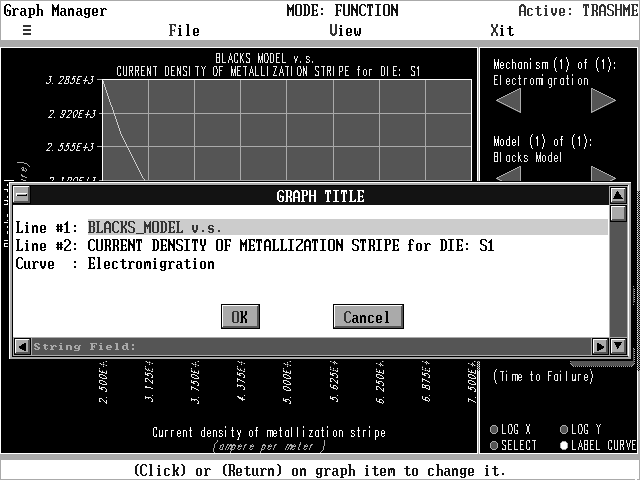
Change what you want, then select OK to accept, or Cancel to quit. Select AutoGrid to have CADMP-II generate the tick format. Figure 53 shows the window which appears when you click on an axis label and Figure 54 shows the window for the graph title. Note that the third entry, the Curve, is the curve label.
The top of the DGM screen contains two options besides Xit:
The File command contains three options (see Figure 55):
The View command has two options (see Figure 56):

Select Attributes if you wish to see what the original values of the attributes you have derated are. Notice that the values are listed according to die. The current failure model on display in the graph is listed at the top of the Attributes viewer (see Figure 58).
The Utilities option contains three options, all of which have been covered in the description of the Reliability Analysis: