Project Objective
The objective of the project is to design a system that is able to measure the pitch and roll angles of a forklift, regardless of its motion.
Team

The project team is
-
Jose Garibay-Mendez
-
Thien Ho
-
Tixin Xue
-
Mouaid Alghazwi
Customer/Market Requirements
The project sponsor requires a program that completes the following requirements:
-
Accurately report the pitch and roll angles of the forklift between positive and negative 25 degrees in real time
-
The system must communicate with HYG's existing vehicle communication network
-
The system must work entirely automatically, without user interaction
Design Challenges
The following diagram shows the project architecture:

The team has faced a few challenges. The first one being that the team was not familiar the sensor and its corresponding software. Most of the time on this project was spent getting the sensor to work. Multiple small issues were discovered, and a final larger issues was discovered in the source code for the sensor. Once these problems were resolved, the next step was transferring the data into Matlab and matching the output values to their corresponding orientation on an xyz plane.
Completing the first market requirement is the teams hardest and most critical task. The accuracy is limited to the sensors precision values. However, the sensor outputs are going to be filtered and that may alter these precision values. The team is using a three-axis simulator and centrigue table to view how true the outputted values are.
The second two requirements are essentially completed on their own. By using the provided sensor and Matlab, the team is able to keep communication via CAN Bus. The Matlab code is also set to run, in real time, after the initial setup.
Outcomes
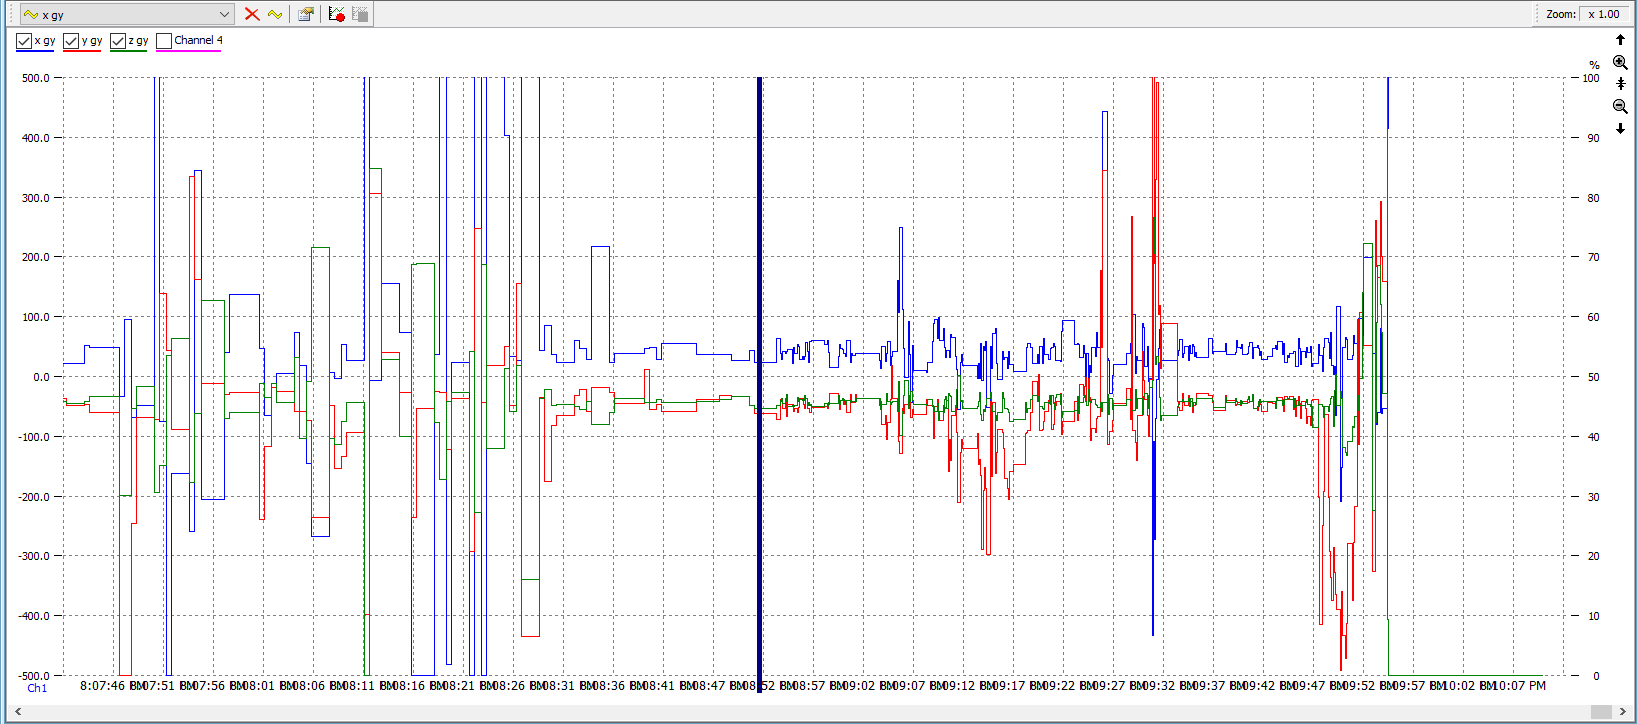
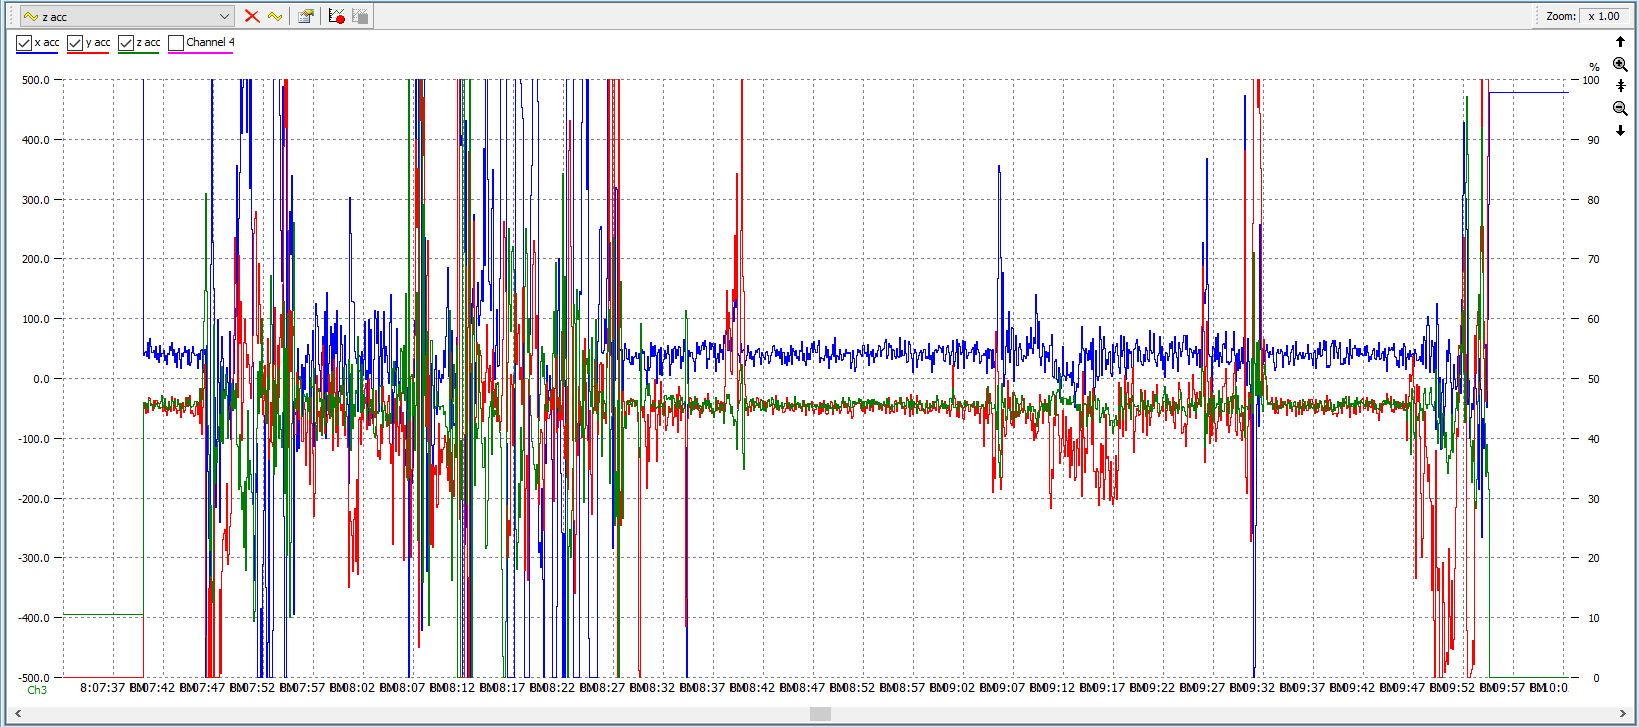
The team has created a graph on Matlab with indicators that would alert the forklift driver when they are near the critial angles.
The following graphs are examples of the of the project in its current state.