Figure 1. Water Quality in the Willamette
River at RM 6.8, 1997-2000

Figure 2. Water Quality in the Willamette
River at RM 17.9, 1997-2000
Willamette River
The Oregon Department of Environmental Quality (DEQ) held the Willamette
River basin Water Quality Data Summit (Corvallis, 2000) with the objectives
of increasing awareness about the current conditions of the Willamette
River Basin, exchanging information about water quality monitoring in the
Basin, and addressing and explaining the TMDL development process.
Presentations on physical and chemical data were made by McKenzie Watershed Council, EPA, City of Salem, National Council Air & Stream Improvement, NRCS, ODEQ, and USGS. Presentations on water quantity were made by USGS and OWRD. Riparian vegetation and aquatic habitat were covered by EPA, OSU Pacific NW Ecosystem Research Consortium, BLM, USFS, and ODFW. Much of the data presented were concerned with regions outside of the models boundary conditions discussed in this report, namely upstream of Salem and in the headwaters controlled by the USFS and BLM.
The DEQ Water Quality Division presented the Willamette River Technical Advisory Steering Committee (WRTASC) studies of dioxin and furan concentration & effects in Willamette River fish as well as distribution of dissolved pesticides in the Willamette River basin. These studies led to a 1999 study initiated to investigate the risk to human health from the consumption of fish from the Newberg Pool area, the level of bacteria contamination in and upstream of the Newberg Pool, and evaluate the in-situ fish embryo bioassay. These reports can be downloaded from http://waterquality.deq.state.or.us/wq/Willamet/reports2000.htm
The Willamette River is listed in the 303(d) list for temperature because it exceeds water quality standards. DEQ held the water quality summit to involve different agencies collecting water quality data in the Willamette River so they can evaluate who has water quality data and what kind of data is available for developing the TMDLs.
The Bureau of Environmental Services (BES) has been collecting water
quality data in the Willamette River during the last 8 years. BES collects
data at 6 monitoring stations along the Willamette River. Grab samples
are taken weekly for the period 1992-2000 and 2 Hydrolabs took continuous
measurements from 1997-2000. Both the grab samples and the Hydrolab measurements
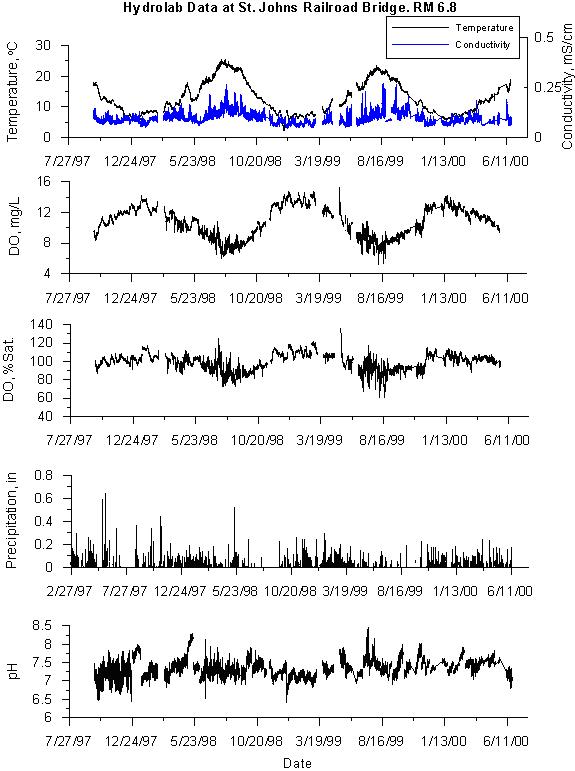
are made at a 10-foot depth. Figure 1 and Figure 2 are examples of the
Hydrolab time series data at St. John's Railroad Bridge (RM 6.8) and the
Waverly Country Club (RM 17.9) for the period 1992-2000. Low concentrations
of dissolved oxygen can be observed in Figure 1 and Figure 2 during the
summers of 1998 and 1999.
Figure 1. Water Quality in the Willamette
River at RM 6.8, 1997-2000
Figure 2. Water Quality in the Willamette
River at RM 17.9, 1997-2000
Columbia River
Water Quality monitoring in the Columbia River is predominately conducted
by DEQ. However, USGS has monitored temperature and some water quality
parameters such as conductivity, dissolved oxygen, and pH hourly. Continuous
temperature data from 1997 to 2000 were obtained from a dissolved gas study
carried out by USGS and the ACOE. DEQ (STORET) data is collected
on a monthly to a few times a year basis.
Temperature data in the Columbia River at Bonneville dam and at Beaver Army Terminal were taken from USGS monitoring and STORET grab samples. Water quality data in the Columbia River at Bonneville dam were obtained from grab samples taken by DEQ (STORET) at Warrendale, Oregon because data at Bonneville Dam were not available. Water quality input files for the model at the Beaver Army Terminal were generated by combining DEQ (STORET) data and continuous USGS data. Figure 3 and Figure 4 show temperature in the Columbia River at Beaver Army Terminal (RM 53.8) and at Bonneville Dam (RM 144.5) respectively.
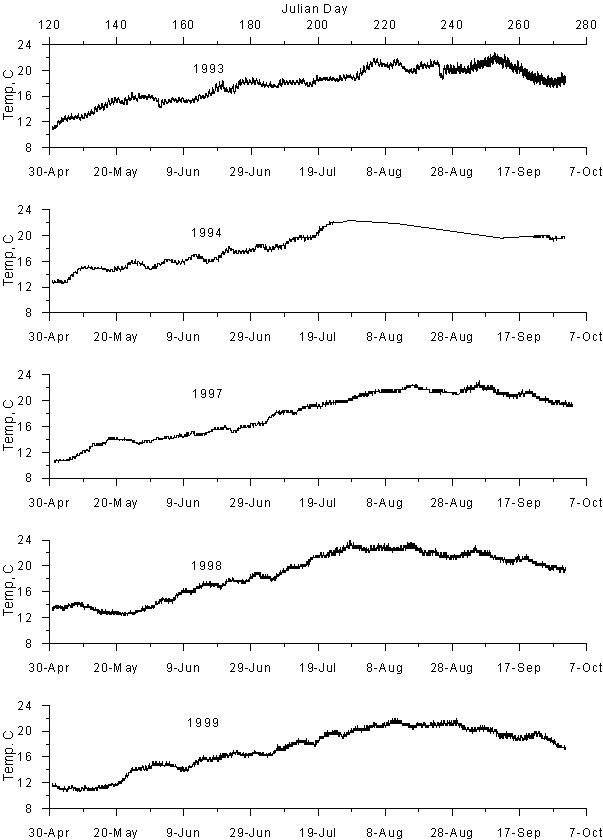
Figure 3. Columbia River at Beaver Army Terminal
(RM 53.8) water temperature,
oC
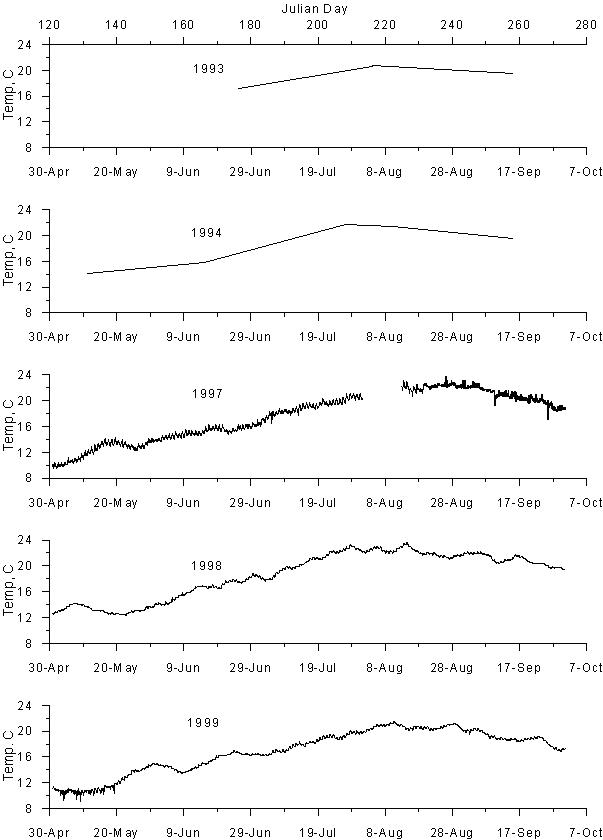
Figure 4. Columbia River at Bonneville Dam (RM 144.5) water temperature, oC