Table 1. ACOE correlations to estimate flow
at Willamette River at Portland
Willamette River
Flow data
USGS developed a flow routing model to estimate daily flows in the Willamette River at Portland. This approach is based on measured daily flows upstream of the Portland gage station (USGS: 14211720). The equation used to estimate flows is:
Mean daily Q at Willamette
River at Salem with 1 day lag
+ (Mean daily Q at South Yamhill) x 2 with 1 day lag
+ (Mean daily Q at Pudding near Woodburn) x 2 with 1 day lag
+ (Mean daily Q at Tualatin River-West Linn ) x 1.5
+ (Mean daily Q at Clackamas River-Estacada) x 1.5
+ Mean daily Q at Johnson Creek-Milwaukie
= Mean daily Q at Willamette River-Portland
The most upstream sites are lagged by one day to account for travel time and some of the lower sites are increased by a factor to account for ungaged flows. The flows from these stations were added together to obtain daily flows in the Willamette River at the Portland gage station (USGS: 14211720).
The U.S Army Corps of Engineers also developed a Lower Columbia River UNET Model (Knutson, 2000), a routing method to estimate daily flows in the Willamette River at Portland. The flow in the Willamette River at Portland was obtained using the following equation:
Mean daily Q at Molalla River-Canby
+ Mean daily Q at South Yamhill-Whiteson
+ Mean daily Q at Pudding-Aurora
+ Mean daily Q at Tualatin River-West Linn
+ Mean daily Q at Clackamas River-Estacada
+ Mean daily Q at W.R at Salem
+ Mean daily Q at Johnson Creek-Sycamore
+ Mean daily Q Ungaged between Salem and Oregon City
= Mean daily Q at Willamette River-Portland
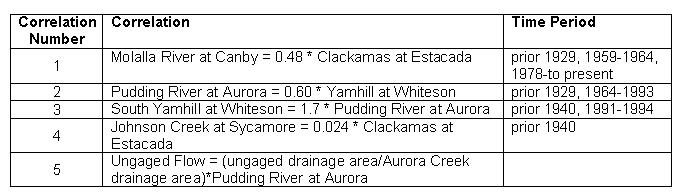
The ACOE developed correlations that relate flow between stations in the Willamette basin to fill gaps found in the data. These correlations are shown in Table 1.
Table 1. ACOE correlations to estimate flow
at Willamette River at Portland
Flow in the Willamette River at Portland was estimated using both the USGS and the ACOE approaches for 1993 and 1994. The results were compared as shown in Figure 1, with daily data measured at the Willamette River at Portland gage station (USGS: 14211720) before it was discontinued in 1994. The difference between the estimated flow and the data was plotted (Figure 2) moreover the standard deviation was calculated to determine which approach gives a better representation of the flows at Portland. Table 2 provides statistics comparing the two flow routing models with data. Based on the AME and RMS errors listed in the table the ACOE flow routing model provided a better approximation to the data and was therefore used in developing the model boundary condition.
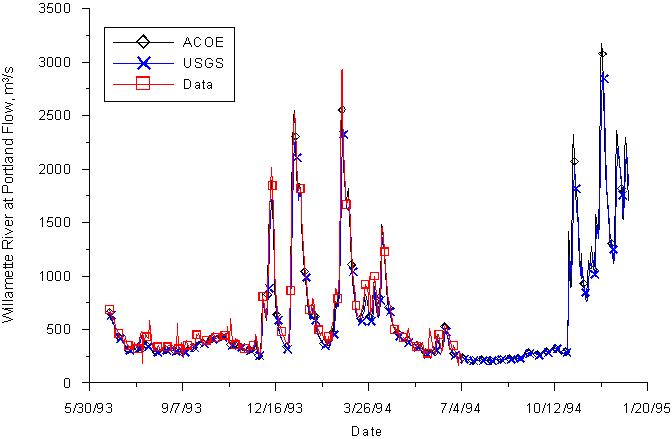
Figure 1. Willamette River at Portland flow
comparison between data and the USGS and ACOE approach

Figure 2. Difference between flow estimated
and measured in the Willamette River at Portland
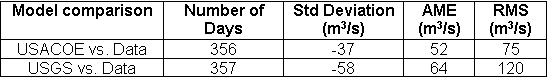
Table 2. Flow Routing Model Comparison with
data Statistics
Willamette River flows near Canby Ferry were obtained using part of
the ACOE flow routing model described above.
The approximation used is as follows:
Mean daily Q at Molalla River-Canby
+ Mean daily Q at South Yamhill
+ Mean daily Q at Pudding-Aurora
+ Mean daily Q at W.R at Salem
+ Mean daily Q Ungaged between Salem and Oregon City
= Mean daily Q near Canby Ferry
Correlations in Table 1 were used to estimate daily flow values for the Molalla River, the ungaged flows, and fill data gaps (1993-1994) for the South Yamhill River. Figure 3 shows the Willamette River flows at Canby Ferry for the summer periods modeled.
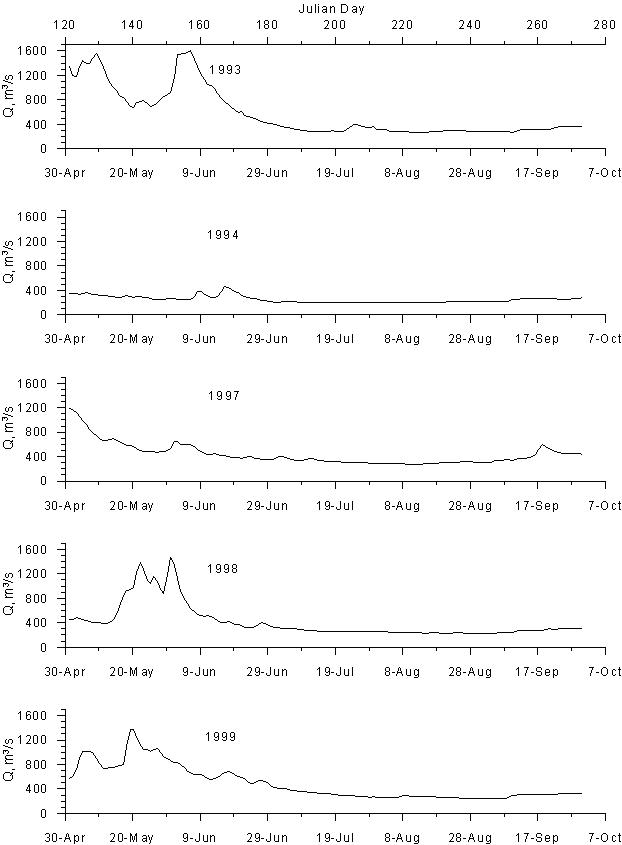
Figure 3. Willamette River flow near Canby Ferry (RM 35), m3/s
Columbia River
Flow Data
Flows at Bonneville Dam were obtained from the
ACOE from January 1993 to 2000. A plot showing flow data below the Bonneville
Dam for all modeled summers is shown in Figure 4.

Figure 4. Columbia River Flow measured below
the Bonneville Dam, m3/s, RM 144.5
Water Level
Columbia River Water Level at Beaver Army Terminal
The Beaver Army Terminal station (USGS: 14246900) has been recording continuous water level data from October 1991 to present. In 1997, 1998 and 1999 there were several gaps in the data. To fill those gaps a correlation was developed between the Beaver Army Terminal site, the Vancouver, WA site (USGS: 14144700), the Longview, WA site (ACOE: LOP), the site below the Bonneville Dam (USGS: 14128870) and the tidal influences on the Columbia River. The correlation used (R2=0.8301) is:
Where:Beaver Army Terminal WL Elev_m = 0.0143 (Hourly)+0.0109 (Daily) - 0.0062 (Monthly)+ 0.0054 (Annually)- 0.2922 (Vancouver WL Elev_m)+ 1.1156 (Longview WL Elev_m)+ 0.0389 (Bonneville WL Elev_m) - 0.1942
Daily is the daily tidal cycle estimated as: ![]()
Monthly is the monthly tidal cycle estimated as: ![]()
Annually is the influence of any annual tidal fluctuations as: ![]()
The water level elevation at Beaver Army Terminal for the summers modeled is shown in Figure 5. Data are represented by black lines and water level information estimated from the correlation are represented by red lines. Although the coefficient of determination was 0.83 the correlated water level information fit well with the existing data for the station.
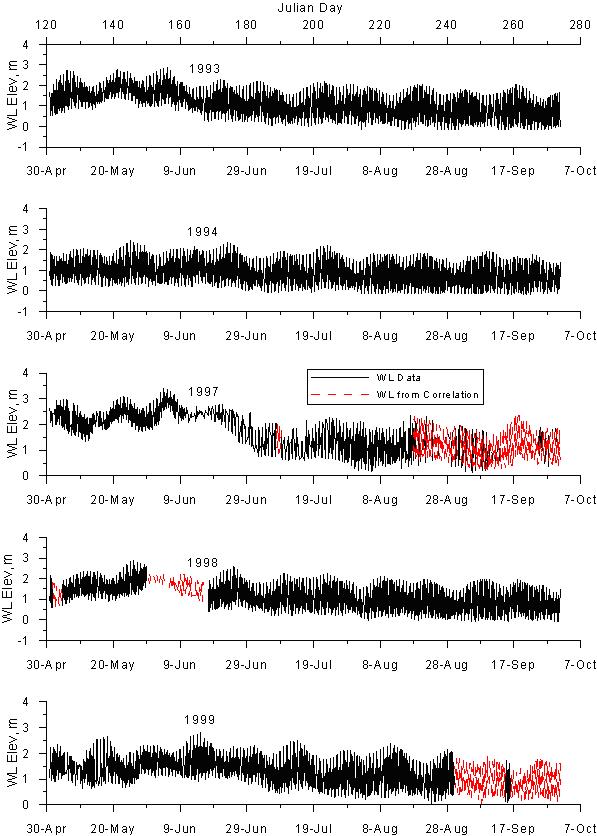
Figure 5. Columbia River Water Level Elevation
at Beaver Army Terminal, m NGVD, RM 53.8 (red: correlated, black: data)