Point Sources
Point sources data for the Columbia and Willamette Rivers were collected from the Discharge Monitoring Reports (DMR) provided by Oregon Department of Environmental Quality (DEQ) and Washington Department of Ecology (WADOE). The Clean Water Act requires that any discharge pollutants through a point source into a water body in the United States shouldhave a National Pollution Discharge Elimination System (NPDES) permit.The NPDES permit may define minimum or maximum limits of discharge constituents and may require periodic monitoring and reporting of the discharge.This reporting is submitted to the local branches of the EPA (Permit Compliance System) and DEQ/WADOE in the form of a Discharge Monitoring Report (DMR).
Oregon
The 1995 QUAL2E model employed in Tetra Tech Inc.'s Willamette River Basin Water Quality Study utilized steady state point source inputs. This differs from the CE-QUAL-W2 Version 3 model, which allows for dynamic point source inputs.This dynamic ability is a significant improvement when considering point sources can have high variability in discharge rates and constituents that are not seasonally related. The QUAL2E model used the point sources shown in Table 12 for the Lower Willamette River. The flow and water quality constituents were derived from the DMRs.
Several of these point sources have changed ownership or name or have stopped discharging since 1995 when Tetra Tech collected the data.Table 13 shows a list of facilities which have changed their name or ownership.
|
|
|
|
Port
of Portland #2
|
Kinder
Morgan Bulk Terminals, Inc.
|
|
Port
of Portland #1
|
Cascade
General, Inc.
|
|
Elf
Autochemical
|
Atofina
Chemicals
|
|
Simpson
Paper Co.
|
West
Linn Paper Co.
|
|
Smurfit
Newsprint Corp.
|
Blue
Heron Paper Co.
|
|
JR
Lawrence
|
Forest
Park Mobile Village
|
|
GS
Gradow
|
Canby
Regency Mobile Home Park
|
In the case of Union oil, Chevron USA, Lone Star NW, Ross Island Sand & Gravel, and Caffall Bros. (Table 12), no quantitative discharge data were available in order to characterize discharge flows or water quality.The Tetra Tech point source labeled Chiloquin is an error.The City of Chiloquin in located in Kalamath County in Southern Oregon on the Williamson River, RM 11.5.
Table 14 identifies the point sources to the Willamette and Columbia Rivers from Oregon that were used in the CE-QUAL-W2 model. Most of the point sources from the Tetra Tech work were included, except the following: Kinder Morgan (Port of Portland #2); Koppers Industries, Inc; Linnton Plywood Association; and Ash Grove Cement Co. because their flows were either zero or negligible.Additional dischargers to the Willamette River that were considered "major" dischargers by DEQ and that had discharge data were also considered.In some cases a company had more than one discharge on the same property or more than one property with a discharge.The locations of these point sources are shown in Figure 61.Data from the point sources was found to be limited.Many water quality constituents, such as nutrients, were not monitored in the point sources.Data was collected on a monthly basis or less frequent.
|
|
|
|
|
|
|
|
13691/A
|
CANBY
STP
|
Willamette
|
|
|
|
97612/B
|
CANBY
REGENCY MOBILE HOME PARK
|
Willamette
|
|
|
|
21489/C-001
|
WEST
LINN PAPER COMPANY
|
Willamette
|
|
|
|
72634/B-001
|
BLUE
HERON PAPER COMPANY
|
Willamette
|
|
|
|
30554/B
|
FOREST
PARK MOBILE VILLAGE
|
Willamette
|
|
|
|
72634/B-002
|
BLUE
HERON PAPER COMPANY
|
Willamette
|
|
|
|
72634/B-003
|
BLUE
HERON PAPER COMPANY
|
Willamette
|
|
|
|
21489/C-002
|
WEST
LINN PAPER COMPANY
|
Willamette
|
|
|
|
89700/A
|
TRI
CITY REGIONAL STP
|
Willamette
|
|
|
|
LOPOWER
|
LAKE
OSWEGO
|
Willamette
|
|
|
|
70735/A
|
TRYON
CREEK WWTP
|
Willamette
|
|
|
|
62795/A
|
OAK
LODGESTP
|
Willamette
|
|
|
|
16590/A
|
KELLOGG
CREEK STP
|
Willamette
|
|
|
|
106060/A
|
OMSI
|
Willamette
|
|
|
|
70596/B-001/7
|
CASCADE
GENERAL, INC.
|
Willamette
|
|
|
|
70596/B-001/8
|
CASCADE
GENERAL, INC.
|
Willamette
|
|
|
|
70596/B-002
|
CASCADE
GENERAL, INC.
|
Willamette
|
|
|
|
70596/B-003
|
CASCADE
GENERAL, INC.
|
Willamette
|
|
|
|
68471/A-003
|
ATOFINA
CHEMICALS, INC.
|
Willamette
|
|
|
|
74995/A-002
|
RHONE-POULENC
AG
|
Willamette
|
|
|
|
74995/A-003
|
RHONE-POULENC
AG
|
Willamette
|
|
|
|
68471/A-001
|
ATOFINA
CHEMICALS, INC.
|
Willamette
|
|
|
|
68471/A-002
|
ATOFINA
CHEMICALS, INC.
|
Willamette
|
|
|
|
74995/A-001
|
RHONE-POULENC
AG
|
Willamette
|
|
|
|
68471/A-004
|
ATOFINA
CHEMICALS, INC.
|
Willamette
|
|
|
|
93450/A-MV1
|
WACKER
SILTRONIC CORPORATION
|
Willamette
|
|
|
|
93450/A-MV3
|
WACKER
SILTRONIC CORPORATION
|
Willamette
|
|
|
|
64905/A-002
|
PORTLAND
STEELWORKS - RIVERGATE
|
Willamette
|
|
|
|
64905/A-001
|
PORTLAND
STEELWORKS - RIVERGATE
|
Willamette
|
|
|
|
84069/A-001
|
ST
HELENS STP
|
Columbia
|
|
|
|
74860/A-002
|
REYNOLDS
ALUMINUM
|
Columbia
|
|
|
|
74860/A-001
|
REYNOLDS
ALUMINUM
|
Columbia
|
|
|
|
74470/C
|
COASTAL
ST. HELENS CHEMICAL
|
Columbia
|
|
|
|
70825/A-001
|
PGE
- TROJAN NUCLEAR POWER PLANT
|
Columbia
|
|
|
|
70825/A-002
|
PGE
- TROJAN NUCLEAR POWER PLANT
|
Columbia
|
|
|
|
35173/A
|
GRESHAMSTP
(SEE FILE NO. 110254)
|
Columbia
|
|
|
|
Ameron/SW
|
AMERON
|
Columbia
|
|
|
|
Ameron/CB
|
AMERON
|
Columbia
|
|
|
|
Ameron/PWW
|
AMERON
|
Columbia
|
|
|
|
Ameron/BBD
|
AMERON
|
Columbia
|
|
Storm and Combination Sewers
One study underway by the City of Portland examines the Swan Island area.A rational method analysis was performed on a storm sewer collection system on Swan Island with water quality measured by the City of Portland, BES at selected manholes.The study estimated flow into the Willamette River and associated water quality for a few winter storms.The study is ongoing and with an expanded scope could provide valuable data for winter modeling.
The City of West Linn utilized the EPA SWMM model to evaluate all existing major basins in West Linn for 10 and 25 year storm events.This model was constructed to provide a Drainage System Capacity Evaluation component to the City of West Linn Master Storm Drain plan.Woodward Clyde Consultants, Inc. performed this study in 1996. Assumptions used to generate the model included:
1.The maximum 24-hour rainfall in the city as derived from the applicable regional NOAA Atlas
2.The standard 10 year return frequency 24-hour maximum rainfall in the city is 3.3 inches.
The distribution of rainfall within the 24-hour period is based on the SCS Type 1A rainfall distribution.
Due
to the lack of consistent water quality and flow data and the focus on
summer low-water conditions in the Lower Willamette River modeling, stormwater
and CSO inflows were not considered as point sources in the model.
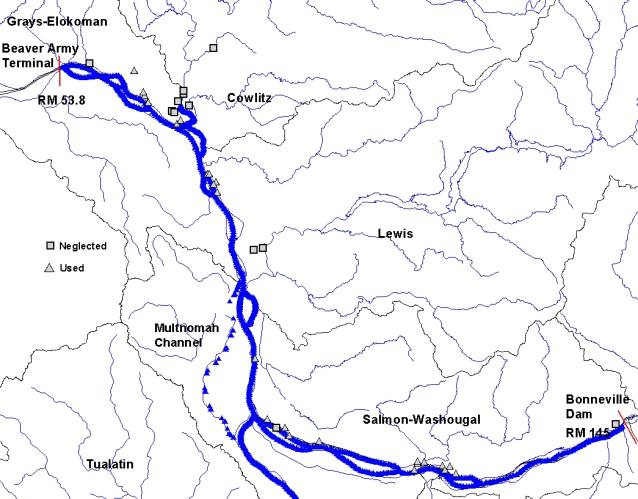
Washington
In Washington the State Department of Ecology was contacted and a list identified for all majorpoint sources contributing to the Columbia River in the model domain.The locations of these sites are shown in Figure 62.Some of the point sources identified discharged into tributaries of the Columbia River downstream of where gaging stations were used to characterize the tributary flows. Eleven sites were neglected from inclusion in the model since their flow was not significant and would not have much influence on water quality in the Lower Willamette as shown in Figure 62. There were 47 point sources considered in the model, and these are listed in Table 16.Some of these point sources were combined if they discharged to the same model segment.Similar to the point sources identified in Oregon, the extent of the data was found to be limited.Many water quality constituents, such as nutrients, were not monitored.Data were collected on a monthly basis or less frequent.
|
|
|
|
|
|
|
|
|
ALLWEATHER
WOOD TREATERS
|
Columbia
|
|
|
|
|
ALLWEATHER
WOOD TREATERS
|
Columbia
|
|
|
|
|
BFGOODRICH
|
Columbia
|
|
|
|
|
BFGOODRICH
|
Columbia
|
|
|
|
|
BFGOODRICH
|
Columbia
|
|
|
|
|
BFGOODRICH
|
Columbia
|
|
|
|
|
BOISE
CASCADE VANCOUVER
|
Columbia
|
|
|
|
|
CAMAS
STP
|
Columbia
|
|
|
|
|
CLARIANT
CORP
|
Columbia
|
|
|
|
|
FORT
JAMES CAMAS
|
Columbia
|
|
|
|
|
FORT
JAMES CAMAS
|
Columbia
|
|
|
|
|
FORT
JAMES CAMAS
|
Columbia
|
|
|
|
|
KALAMA
STP
|
Columbia
|
|
|
|
|
LONGVIEW
FIBRE LONGVIEW
|
Columbia
|
|
|
|
|
LONGVIEW
FIBRE LONGVIEW
|
Columbia
|
|
|
|
|
LONGVIEW
STP
|
Columbia
|
|
|
|
|
MARINE
PARK WATER RECLAMATION FACIL
|
Columbia
|
|
|
|
|
PORT
OF KALAMA
|
Columbia
|
|
|
|
|
REYNOLDS
METALS LONGVIEW
|
Columbia
|
|
|
|
|
REYNOLDS
METALS LONGVIEW
|
Columbia
|
|
|
|
|
REYNOLDS
METALS LONGVIEW
|
Columbia
|
|
|
|
|
REYNOLDS
METALS LONGVIEW
|
Columbia
|
|
|
|
|
SALMON
CREEK STP
|
Columbia
|
|
|
|
|
VANALCO
|
Columbia
|
|
|
|
|
VANALCO
|
Columbia
|
|
|
|
|
VANCOUVER
WEST STP
|
Columbia
|
|
|
|
|
WASHOUGAL
STP
|
Columbia
|
|
|
|
|
WEYERHAEUSER
LONGVIEW
|
Columbia
|
|
|
|
|
WEYERHAEUSER
LONGVIEW
|
Columbia
|
|
|
|
|
WEYERHAEUSER
LONGVIEW
|
Columbia
|
|
|
|
|
WEYERHAEUSER
LONGVIEW
|
Columbia
|
|
|
|
|
WEYERHAEUSER
LONGVIEW
|
Columbia
|
|
|
|
|
WEYERHAEUSER
LONGVIEW
|
Columbia
|
|
|
|
|
WEYERHAEUSER
LONGVIEW
|
Columbia
|
|
|
|
|
WEYERHAEUSER
LONGVIEW
|
Columbia
|
|