Meteorological Data
Meteorological data were collected at Portland International Airport and include air temperature, wind speed, wind direction, dew point, and cloud cover. Figure 32 shows the location of the Portland International Airport and several other meteorological stations in the model region.The Portland International Airport was selected because it contained the longest historical record of data and fairly represents the meteorological conditions in the model domain.Future work could investigate the feasibility of using additional meteorological stations such as the Aurora Airport.Figure 33 through Figure 37 show the meteorological data at the Portland International Airport from January 1992 to September 2000.In Figure 37 cloud cover varies on a scale of 0 to 10 with zero representing no cloud cover and ten representing full cloud cover.In July 1996 the method for measuring cloud changed to a scale of 1 to 4 resulting in less approximate conditions.The scale was converted to a 1 to 10 scale to be compatible with historical data.
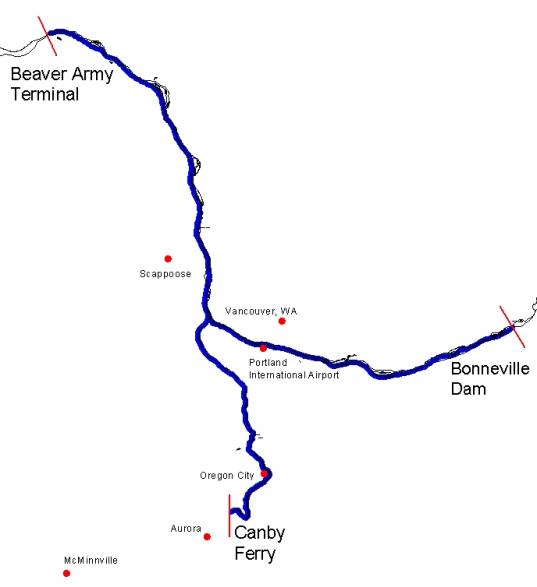
Figure 32.Location
of several met stations in the model region
Figure33.Air Temperature, oC, 10 day moving average at the Portland International Airport 1992-2000
Figure 34.Dew Point Temperature, oC, 10 day moving average at the Portland International Airport 1992-2000
Figure 35.Wind Speed, m/s, 10 day moving average at the Portland International Airport, 1992-2000
Figure 36.Wind Direction, degrees, 10 day moving average at the Portland International Airport, 1992-2000
Figure37.Cloud Cover 10 day moving average at the Portland International Airport, 1992-2000