Model Boundary Conditions
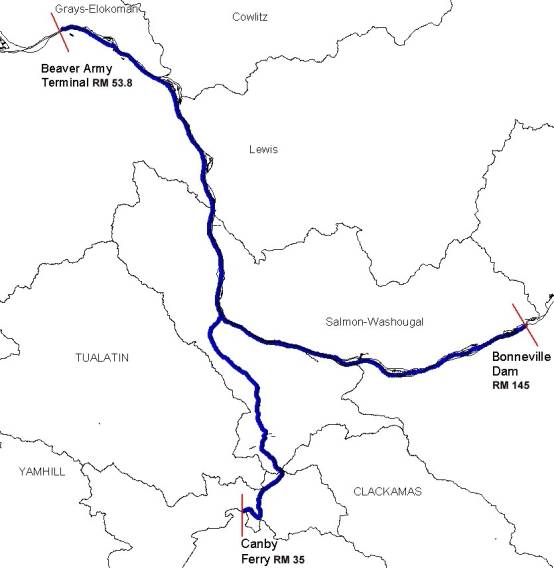
Figure13. Model Boundaries on the Columbia and Willamette Rivers
Columbia River
Columbia River Water Level at Beaver Army Terminal
Where:
Hourly is the tidal influence from 12.4 hour tidal
cycle as:![]()
Daily is the daily tidal cycle estimated as:![]()
Monthly is the monthly tidal cycle estimated as: ![]()
Annually is the influence of any annual tidal fluctuations
as: ![]()
The water level elevation at Beaver Army Terminal for the summers modeled is shown in Figure 14.Although the coefficient of determination was 0.83 the correlated water level information fit well with the existing data for the station.
Figure14. Columbia River Water Level Elevation at Beaver Army Terminal, m NGVD, RM 53.8
Columbia River Flow at Bonneville Dam
Figure15.Columbia River Flow measured below the Bonneville Dam, m3/s, RM 144.5
Water Quality
Temperature data in the Columbia River at Bonneville dam and at Beaver Army Terminal were taken from USGS monitoring and STORET grab samples.Water quality data in the Columbia River at the Bonneville Dam were obtained from grab samples taken by DEQ (STORET) at Warrendale, Oregon because data at the Bonneville Dam were not available.Water quality input files for the model at the Beaver Army Terminal were generated by combining DEQ (STORET) data and continuous USGS data. Figure 16 and Figure 17 show temperature in the Columbia River at Beaver Army Terminal (RM 53.8) and at Bonneville Dam (RM 144.5) respectively. Table 3 shows a list of water quality parameters available for the Columbia River at Bonneville Dam and Beaver Army Terminal.
Figure 18 through Figure 20 shows plots of the water quality constituents used for the downstream boundary condition at Beaver Army Terminal.Figure 21 through Figure 23 show similar water quality plots for the Columbia River at the Bonneville Dam.The procedure used for developing the water quality files from data can be found in Appendix J:Water Quality file development procedures.
Figure16.Columbia River at Beaver Army Terminal (RM 53.8) water temperature, oC
Figure17.Columbia
River at Bonneville Dam (RM 144.5) water temperature, oC
|
Parameters |
|
|
|
ALKALINAS
CACO3
|
|
|
|
Alkalinity
|
|
|
|
Calcium
Hardness
|
|
|
|
CHLRPHYLA
|
|
|
|
Conductivity,
mS/cm
|
|
|
|
D
ORG CC
|
|
|
|
Dissolved
Oxygen
|
|
|
|
D.O
Saturation
|
|
|
|
ENTCOCCI
|
|
|
|
Fecal
Coliforms ./100 mL
|
|
|
|
NH3+NH4-N
DISS
|
|
|
|
NH3+NH4-N
TOTAL
|
|
|
|
NO2&NO3N-DISS
|
|
|
|
NO2&NO3N-TOTAL
|
|
|
|
NO2-NDISS
|
|
|
|
NO2-NTOTAL
|
|
|
|
PH
|
|
|
|
PHOS-DIS
|
|
|
|
PHOS-DISORTHO
|
|
|
|
PHOSPHORSED,SUSP
|
|
|
|
PHOS-TORTHO
|
|
|
|
PHOS-TOT
|
|
|
|
S
ORG CC
|
|
|
|
SUSP
SEDCONC
|
|
|
|
SUSP
SEDDISCHARG
|
|
|
|
SUSP
SEDPARTSIZE
|
|
|
|
T
ALKCACO3
|
|
|
|
Temperature
|
|
|
|
Turbidity
|
|
|
|
UN-IONZDNH3-N
|
|
|
|
UN-IONZDNH3-NH3
|
|
|
Figure 18.Columbia
River at Beaver Army Terminal Boundary Condition, RM 54
Figure 19.Columbia
River at Beaver Army Terminal Boundary Condition, RM 54 (Part 2)
Figure 20.Columbia
River at Beaver Army Terminal Boundary Condition, RM 54 (Part 3)
Figure 21.Columbia
River at Bonneville Dam Boundary Condition, RM 145
Figure 22.Columbia
River at Bonneville Dam Boundary Condition, RM 145 (Part 2)
Figure 23.Columbia
River at Bonneville Dam Boundary Condition, RM 145 (Part 3)
Willamette River
Flow data
Mean daily Q at Willamette River at Salem with 1 day lag+(Mean daily Q at South Yamhill) x 2 with 1 day lag+(Mean daily Q at Pudding near Woodburn) x 2 with 1 day lag+(Mean daily Q at Tualatin River-West Linn ) x 1.5+(Mean daily Q at Clackamas River-Estacada) x 1.5+Mean daily Q at Johnson Creek-Milwaukie=Mean daily Q at Willamette River-Portland
The most upstream sites are lagged by one day to account for travel time and some of the lower sites are increased by a factor to account for ungaged flows. The flows from these stations were added together to obtain daily flows in the Willamette River at the Portland gage station (USGS: 14211720).
The U.S Army Corps of Engineers also developed the Lower Columbia River UNET Model (Knutson, 2000), a routing method to estimate daily flows in the Willamette River at Portland. The flow in the Willamette River at Portland was obtained using the following equation:
Mean daily Q at Molalla River-Canby+Mean daily Q at South Yamhill-Whiteson+Mean daily Q at Pudding-Aurora+Mean daily Q at Tualatin River-West Linn+Mean daily Q at Clackamas River-Estacada+Mean daily Q at W.R at Salem+Mean daily Q at Johnson Creek-Sycamore+Mean daily Q Ungaged between Salem and Oregon City=Mean daily Q at Willamette River-Portland
In order to utilize this flow routing equation for a larger period of time the USACOE developed several flow correlations between stations in the Willamette basin to fill gaps found in the data. These correlations are shown in Table 4.
|
|
Correlation
|
Time
Period
|
|
|
Molalla
River at Canby = 0.48 * Clackamas at Estacada
|
prior
1929, 1959-1964, 1978-to present
|
|
|
Pudding
River at Aurora = 0.60 * Yamhill at Whiteson
|
prior
1929, 1964-1993
|
|
|
South
Yamhill at Whiteson = 1.7 * Pudding River at Aurora
|
prior
1940, 1991-1994
|
|
|
Johnson
Creek at Sycamore = 0.024 * Clackamas at Estacada
|
prior
1940
|
|
|
Ungaged
Flow = (ungaged drainage area/Aurora Creek drainage area)*Pudding River
at Aurora
|
|
In order to determine which flow routing model was more appropriate for developing the boundary condition the flow in the Willamette River at Portland was estimated using both models for 1993 and 1994. The results were compared as shown in Figure 24, with daily data measured at the Willamette River at Portland gage station (USGS: 14211720) before it was discontinued in 1994. The difference between the estimated flows and the data were plotted in Figure 25.Error statistics were calculated, as shown in Table 5, to determine which approach gives a better representation of the flows at Portland.Based on the AME and RMS errors listed in the table the USACOE flow routing model provided a better approximation of the flow and was therefore used in developing the model boundary condition.
Figure24.Willamette
River Flow at Portland comparison between data, the USGS model and the
USACOE model
Figure25.Flow
difference between data and routing models in Willamette River at Portland
|
|
|
(m3/s) |
|
|
|
|
|
|
|
|
|
|
|
|
|
|
Willamette River flow near Canby Ferry was obtained using part of the USACOE flow routing model described above. The flow approximation was used:
Mean daily Q at Molalla River-Canby+Mean daily Q at South Yamhill+Mean daily Q at Pudding-Aurora+Mean daily Q at W.R at Salem+Mean daily Q Ungaged between Salem and Oregon City=Mean daily Q near Canby Ferry
|
|
|
|
|
|
|
|
|
|
USGS14191000
|
Willamette
River at Salem
|
|
|
|
|
|
|
|
USGS14192500
|
South
Yamhill River near Willamina
|
|
|
|
|
|
|
|
USGS14193000
|
Willamina
Creek near Willamina
|
|
|
|
|
|
|
|
USGS14194000
|
South
Yamhill River near Whiteson
|
|
|
|
|
|
|
|
USGS14194150
|
South
Yamhill River at McMinnville
|
|
|
|
|
|
|
|
USGS14201340
|
Pudding
River near Woodburn
|
|
|
|
|
|
|
|
USGS14202000
|
Pudding
River at Aurora
|
|
|
|
|
|
|
|
USGS14210000
|
Clackamas
River at Estacada
|
|
|
|
|
|
|
|
USGS14211720
|
Willamette
River at Portland
|
|
|
|
|
|
|
Due to data gaps at some of the gage stations correlations were developed between stations where data existed and the correlations in Table 4 were utilized to fill these gaps for the summers of 1993, 1994 and 1997 through 1999.The equation for developing the boundary condition flow at Canby Ferry used the daily flow data from the USGS gage station on the Willamette River at Salem for all five summers.The Molalla River flow was calculated using correlation 1 in Table 4 and the daily flow data from the Clackamas River at Estacada gage station.
For the summers of 1993 and 1994 the Pudding River flow was obtained from the Pudding River at Aurora gage station and for the summers of 1997 through 1999 the Pudding River at Woodburn gage station was used since the Aurora gage station was no longer operational.A correlation could not be developed between the two gages on the Pudding River because none of the data overlapped in time.The South Yamhill River flow at Whiteson was calculated using correlation 3 in Table 4 and the Pudding River flow at Aurora for 1993 and 1994.The South Yamhill River at McMinneville flow data was used for the flow at Whiteson for the summers of 1997 through 1999 since the stations were close together.The ungaged flow to the Willamette River between Salem and Oregon City was calculated using correlation 5 in Table 4 and the Pudding River flow (Aurora or Woodburn gage station data).
The remaining gap that existed in the data was from 05/01/1993 to 06/21/1993 at the Pudding River at Aurora gage station.Because of this gap the South Yamhill River flow and the ungaged basin flow could not be calculated.In order to fill the gap flow data from the South Yamhill basin was utilized.The goal of the analysis was to develop a daily flow time series for the South Yamhill River at Whiteson for 05/01/1993 to 06/21/1993.The first step in the analysis was to combine data upstream on the South Yamhill.Willamina Creek near Willamina (USGS: 14193000) has flow data from 1934 to 1991 and the South Yamhill near Willamina (USGS: 14192500) had flow data from 1934 to 1993. Table 6 lists the stations utilized in this analysis and the extent of the data at each station.A correlation was developed between these two gages station to complete the flow record at Willamina Creek for 1991 to 1993.The flow relationship used was 0.3926(Q, South Yamhill near Willamina, cfs)=Q, Willamina Creek near Willamina, cfs (R2=0.9459).The correlation was then used to complete the data set for Willamina Creek and then the flows from the two gage stations were added together.The flow below Willamina was then correlated with the South Yamhill River flow at Whiteson (USGS: 14194000).The correlation developed was: 1.8986(South Yamhill below Willamina)=South Yamhill at Whiteson (R2=0.8078).This correlation was then used to extend the flow record at Whiteson through June 21, 1993.The extended flow record at Whiteson was then used with correlation 2 inTable 4 to calculate the flow in the Pudding River at Aurora.Correlation 5 in Table 4 was then used to calculate the ungaged basin flow.Since several correlations were used to develop the necessary flows on the South Yamhill River a comparison was made between the Willamette River at Canby Ferry flow with the South Yamhill Correlations developed above and with using the Pudding River at Aurora data when it was available. Figure 26 shows the comparison plot with flow difference statistics.Figure 27 shows the Willamette River flows at Canby Ferry for the summer periods modeled.
Figure26.Willamette
River at Canby Ferry flow comparison, Summer 1993
Figure27.Willamette River flow near Canby Ferry (RM 35), m3/s
Water Quality
Figure28.Willamette River at Canby Ferry water temperature, oC
|
Parameters |
|
|
Alkalinity
|
|
|
Ammonia-Nitrogen
mg/L
|
|
|
BOD5
DAY
|
|
|
Calcium
Hardness
|
|
|
CHLRPHYLA
|
|
|
COLORPT-CO
|
|
|
Conductivity,
mS/cm
|
|
|
D
ORG CC
|
|
|
Dissolved
Oxygen
|
|
|
D.O
Saturation
|
|
|
E.COLI
|
|
|
ENTCOCCI
|
|
|
Fecal
Coliforms ./100 mL
|
|
|
NH3+NH4-N
TOTAL
|
|
|
Nitrate-N
mg/L
|
|
|
NO2&NO3N-DISS
|
|
|
NO2&NO3N-TOTAL
|
|
|
PH
|
|
|
PHOS-DISORTHO
|
|
|
PHOS-TOT
|
|
|
SUSP
SEDCONC
|
|
|
T
ALKCACO3
|
|
|
T
ORG CC
|
|
|
Temperature
|
|
|
Total
Coliform
|
|
|
Total
Hardness
|
|
|
Turbidity
|
|
|
UN-IONZDNH3-N
|
|
|
UN-IONZDNH3-NH3
|
|
Figure 29.Willamette
River at Canby Ferry Boundary Condition, RM 35
Figure 30.Willamette
River at Canby Ferry Boundary Condition, RM 35 (Part 2)
Figure 31.Willamette
River at Canby Ferry Boundary Condition, RM 35 (Part 3)