bomb3: A pwndbg Dynamic-Analysis Walkthrough
- Why do this with a debugger
- What you need
- The split interface
- Triage: the symbols you get, and the ones you don’t
- The method: let it explode, then read the stack
- Phase 1 — a string that is built, not stored
- Phase 2 — a function that undoes itself
- Phase 3 — recovering the shape of an array
- Phase 4 — a state machine, and a table with a stride of 3
- Phase 5 — calling the bomb’s own functions
- All five, for real
- The other five are yours
- Transferring this to HW #3
- Key takeaways
- References
Why do this with a debugger
The Ghidra walkthrough works two crackmes without ever running them. This page is the mirror image: a binary bomb, worked entirely dynamically, with no decompiler and no source.
The two disciplines fail in opposite directions. Static analysis tells you what a program will do on every input, but it has to model every transformation in your head — and if the program builds a value at run time, you have to build it too. Dynamic analysis only ever tells you what happened on this run, but it never has to model anything: you let the program compute, then read the answer out of memory.
bomb3’s first phase exists to make that point. Its answer never appears in the
file:
$ strings bomb3 | grep -i 'dynamic analysis'
$                                   # no hits
Yet the program compares your input against it directly. Something constructs it
between main and that comparison, and a debugger lets you simply watch that
happen.
⚠️
bomb3is not the homework bomb. It ships in the sameadadownload as the HW #3 samples, but the graded bombs there arebombandbomb2. Everything here is a worked practice run you are free to read in full; it gives away none of the graded work. The techniques are the entire point, and they transfer directly.
What you need
bomb3 is an x86-64 ELF, dynamically linked, built non-PIE. Download it onto
the machine you will be debugging on — bomb3, or straight into
a shell there:
$ curl -O https://web.cecs.pdx.edu/~dmcgrath/courses/F26/malware/bomb3/bomb3
$ chmod +x bomb3
$ file bomb3
bomb3: ELF 64-bit LSB executable, x86-64, version 1 (SYSV), dynamically linked, ...
There is a 32-bit build beside it, bomb3-32, if you want to
see the same phases with 32-bit calling conventions.
The addresses on this page are from one particular build, and yours will differ. Non-PIE means the addresses are stable across runs — which is what makes a bare
break *0x4013f8work at all — but it says nothing about stability across compilers. The build this page was written against used GCC 16.1.1 and putexplode_bombat0x4013f8; GCC 16.2.1, a patch release three weeks later, puts it at0x40153band shifts every other address by the same kind of amount.So treat every literal address here as an example of a value you will look up, never as a value to type. The first command of each section below is the one that gives you yours:
$ nm bomb3 | grep -E ' [tT] (explode_bomb|main)$'
000000000040153b t explode_bomb
0000000000401c5d T main
Then
break explode_bombby name, and take thecallsites and branch targets from your ownbtanddisassemble main. The method is the transferable part; the hex is not.
$ file bomb3
bomb3: ELF 64-bit LSB executable, x86-64, version 1 (SYSV), dynamically linked,
interpreter /lib64/ld-linux-x86-64.so.2, ... for GNU/Linux 6.1.0, not stripped
“not stripped” is doing less work than you would hope — see triage below.
Install pwndbg and run it inside
tmux. The tmux part is not decoration: pwndbg’s
splitmind integration drives
tmux split-window to put each context section in its own pane, and outside tmux it
silently does nothing.
$ tmux new-session -A -s bomb
$ pwndbg ./bomb3
Two settings are worth passing up front. -iex runs them before the binary loads,
which matters for the first one — by the time a plain -ex fires, the fetch has
already been attempted:
$ pwndbg -iex 'set debuginfod enabled off' -iex 'set show-tips off' ./bomb3
Without that, every start stalls for ten or twenty seconds on a debuginfod lookup that cannot succeed anyway:
Downloading separate debug info for /home/remnux/malware/samples/bomb3/bomb3
Download failed: Invalid argument.  Continuing without separate debug info
(No debugging symbols found in ./bomb3)
The split interface
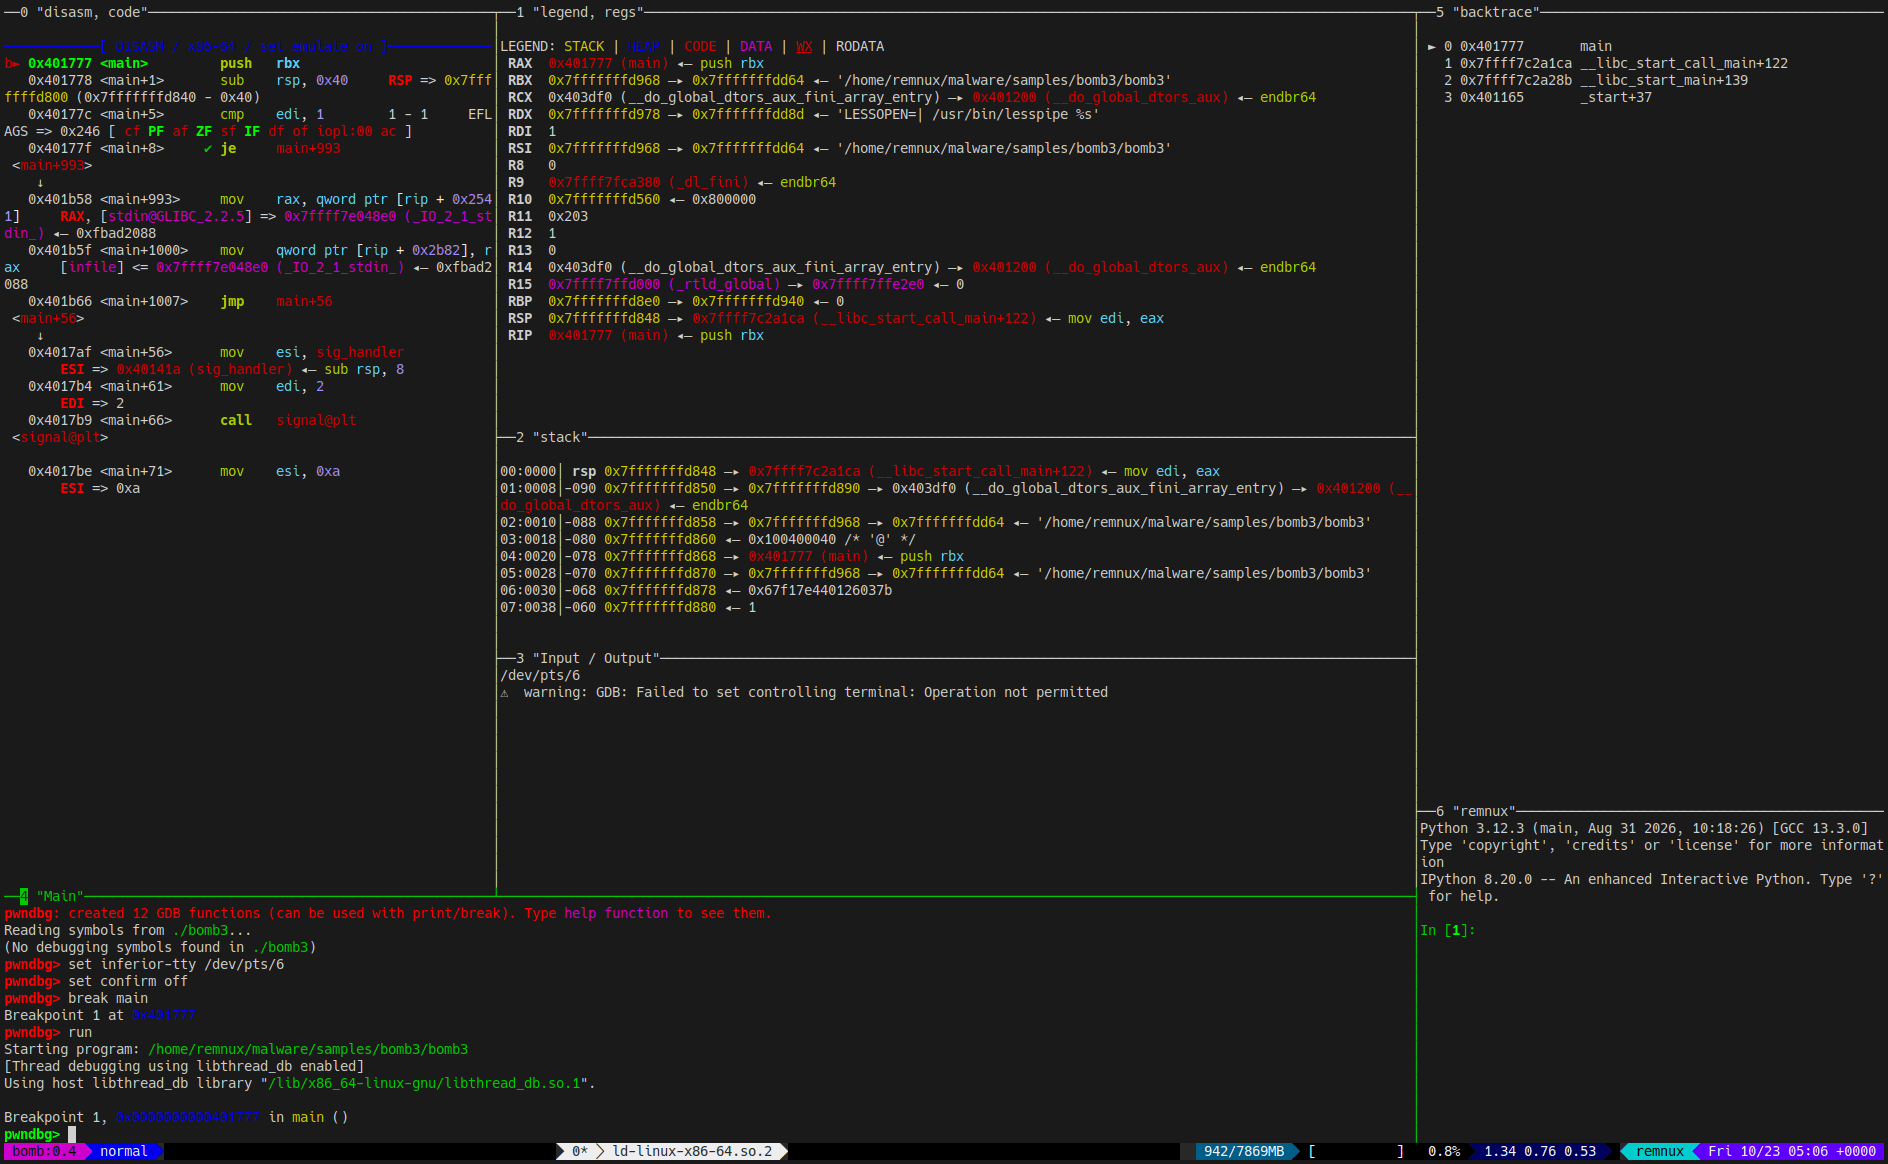
Every screenshot on this page links to itself. The panes are dense at page width – click a figure to open it at full resolution.
Seven panes, each a context section that plain pwndbg would otherwise print as one long scroll at every stop:
| Pane | Shows | Why you care here |
|---|---|---|
| disasm, code | instructions around $rip |
the check you are standing on |
| legend, regs | register file, colour legend | where the computed answer lands |
| stack | memory at $rsp |
decoded buffers live here |
| Input / Output | the bomb’s own stdin/stdout | your phase answers go here |
| Main | the pwndbg> prompt |
everything you type |
| backtrace | call stack | proves which function you are in |
| remnux | IPython | scratch arithmetic without leaving the pane |
The layout is worth the setup cost because each pane keeps its own history. When you step, the disassembly pane updates in place instead of pushing the previous context off your screen — so “what did the registers look like before that instruction” is a glance rather than a scroll.
Routing the bomb’s output to the I/O pane
By default the bomb’s own stdout lands in the Main pane, interleaved with gdb’s, and the “Input / Output” pane does nothing but print its device name. Make it live up to its title. Read the tty from that pane, then:
pwndbg> set inferior-tty /dev/pts/6
From then on the bomb’s prompts and your answers stay in their own pane. You will see one complaint the first time the program starts:
warning: GDB: Failed to set controlling terminal: Operation not permitted
That is expected and harmless — gdb cannot make a pane it does not own the controlling terminal — and the redirection works regardless.
One more, so kill stops asking for confirmation mid-session:
pwndbg> set confirm off
Triage: the symbols you get, and the ones you don’t
file said “not stripped”, so start by asking for the phase functions:
pwndbg> info functions phase
All functions matching regular expression "phase":

Non-debugging symbols:
0x000000000040155b  phase_defused
One hit, and it is not a phase. There is no phase_1, no phase_2, nothing. The
build inlined all ten of them into main, which the symbol table shows plainly:
$ readelf -sW bomb3 \
  | awk '$4=="FUNC" && $2!="0000000000000000" {printf "%s %6s  %s\n",$2,$3,$8}' \
  | grep -v GLIBC | sort -u
...                           (CRT startup stubs omitted)
0000000000401240     36  hof_female
0000000000401264     30  hof_male
0000000000401282     63  is_big_square
00000000004012c1    114  has_digit_sum_20
0000000000401333     25  is_power_of_two
000000000040134c    113  is_prime_ending_in_7
00000000004013bd     59  is_automorphic
00000000004013f8     34  explode_bomb
000000000040141a     44  sig_handler
0000000000401446    104  is_five_digit_palindrome
00000000004014ae    173  read_line
000000000040155b    540  phase_defused
0000000000401777   1554  main          <-- all ten phases are in here
1554 bytes of main, and the helper predicates that survived
(is_big_square, has_digit_sum_20, …) belong to phases further in than we are
going. “Not stripped” bought us explode_bomb and read_line. It did not buy us a
map.
The data symbols, though, survived intact — and they are the ones that matter:
$ readelf -sW bomb3 \
  | awk '$4=="OBJECT" && $2!="0000000000000000" {printf "%s %6s  %s\n",$2,$3,$8}' \
  | grep -vE 'GLIBC|__|_IO_|_DYNAMIC|_GLOBAL_OFFSET|completed' | sort -u
0000000000402400     48  handlers
0000000000402430     16  feistel_key
0000000000402440     64  maze
0000000000402480     56  vm_prog
00000000004024c0     64  records
0000000000402500     18  dfa
0000000000402520    140  grid
00000000004025c0     46  p1_enc
00000000004040e0   1536  input_strings
00000000004046e0      4  num_input_strings
00000000004046e8      8  infile
p1_enc — 46 bytes, and phase 1’s answer is not in strings. grid — 140 bytes,
which is 35 four-byte integers. Hold on to both.
⚠️ No DWARF means no types. The symbols carry addresses and sizes, nothing else.
p sizeof(grid)fails with'grid' has unknown type; cast it to its declared type, and everyreadelf, not from gdb.
The same triage, without leaving gdb
The readelf pipelines above are the thorough version, and they are what gives
you the sizes. But you do not have to leave the session to filter a symbol
list: pipe sends any gdb command’s output into a shell pipeline, and | is
its short form.
pwndbg> pipe info functions | grep -c "^0x"
38
Thirty-eight symbols, which is why info functions phase was the right first
question — reading all of them is not a plan. The data symbols come out the
same way:
pwndbg> pipe info variables | grep -E "^0x00000000004024|^0x00000000004025"
0x0000000000402400  handlers
0x0000000000402430  feistel_key
0x0000000000402440  maze
0x0000000000402480  vm_prog
0x00000000004024c0  records
0x0000000000402500  dfa
0x0000000000402520  grid
0x00000000004025c0  p1_enc
0x00000000004025f0  __GNU_EH_FRAME_HDR
The same eight names as the readelf table, minus the sizes — gdb’s symbol
listing carries addresses and names only. That is the same limitation as the
missing types, and the reason the sizes in this walkthrough come from
readelf.
Useful variants once the bomb is running:
| Command | Effect |
|---|---|
pipe vmmap \| grep rwx |
Writable and executable regions, nothing else |
pipe telescope $rsp 40 \| grep 0x6040 |
Only the stack slots pointing into .data |
pipe \| grep rip |
Re-run the last command and filter it — interactive only |
pipe -d ! print 5 \| 2 ! grep . |
-d sets a different delimiter, for a gdb command that itself contains a \| |
⚠️ Anchored patterns and colour do not mix. pwndbg’s colour escapes come before the leading spaces on each line, so
pipe vmmap | grep "^ *0x"matches nothing at all — no error, just an empty result. Useset disable-colors on, or strip the escapes in the pipeline:pipe vmmap | sed 's/\x1b\[[0-9;]*m//g' | grep "^ *0x". Unanchored patterns likegrep rw-pare unaffected.
pipe needs GDB 9.1 or newer (February 2020). The course VM is well past
that; on an older box, set logging file /tmp/gdb.log plus
set logging enabled on and a grep afterwards is the fallback.
The method: let it explode, then read the stack
With no phase symbols, the way in is the one function the bomb cannot do without. Break on it by name — never by address — feed the bomb garbage, and ask where the call came from. Your hex will not match the transcript; the shape of it will:
pwndbg> break explode_bomb
Breakpoint 1 at 0x4013f8
pwndbg> run
...
Breakpoint 1, 0x00000000004013f8 in explode_bomb ()
pwndbg> bt
#0  0x00000000004013f8 in explode_bomb ()
#1  0x0000000000401bb5 in main ()
#2  0x00007ffff7c2a1ca in __libc_start_call_main (...)
Frame #1 is the whole trick. The return address 0x401bb5 means the call itself
sat at 0x401bb0, five bytes earlier. The compiler has herded every detonation into
one cold block at the end of main:
0x0000000000401bb0 <main+1081>:  call   0x4013f8 <explode_bomb>
0x0000000000401bb5 <main+1086>:  call   0x4013f8 <explode_bomb>
0x0000000000401bba <main+1091>:  call   0x4013f8 <explode_bomb>
...
One call per failed check, stacked back to back. So each phase’s check is whatever
jumps into its call, and one grep finds it:
pwndbg> disassemble main
...
   0x000000000040182c <+181>:   jne    0x401bb0 <main+1081>
   0x0000000000401863 <+236>:   je     0x401bb5 <main+1086>
   0x000000000040186d <+246>:   jne    0x401bb5 <main+1086>
   0x00000000004018ca <+339>:   jne    0x401bba <main+1091>
Exactly one branch reaches 0x401bb0: the jne at main+181. That is phase 1’s
verdict, and the instruction before it is where the answer is sitting in a register.
Two branches reach 0x401bb5 — phase 2 validates its input before it checks it.
This is the loop you will run for every phase: explode, backtrace, find the branch, break just before it.
Phase 1 — a string that is built, not stored
The branch is at main+181. Look at what feeds it:
pwndbg> x/10i 0x401800
   0x401800 <main+137>:  mov    esi,ecx
   0x401802 <main+139>:  xor    sil,BYTE PTR [rdx+0x4025c0]
   0x401809 <main+146>:  mov    BYTE PTR [rsp+rdx*1+0x10],sil
   0x40180e <main+151>:  add    rdx,0x1
   0x401812 <main+155>:  add    ecx,0x3
   0x401815 <main+158>:  cmp    rdx,0x2e
   0x401819 <main+162>:  jne    0x401800 <main+137>
   0x40181b <main+164>:  mov    BYTE PTR [rsp+0x3e],0x0
   0x401820 <main+169>:  lea    rsi,[rsp+0x10]
   0x401825 <main+174>:  call   0x4010d0 <strcmp@plt>
A decode loop, and you can read its whole specification off the registers: source
0x4025c0 — that is p1_enc — destination rsp+0x10, XOR key starting at 0x5c
and stepping +3 each byte, running 0x2e = 46 times. 46 is exactly the size
readelf reported for p1_enc.
You could reimplement that. Don’t. The program is about to do it for you — break on the comparison instead and let it finish:
pwndbg> break *0x401825
pwndbg> continue
Type anything into the I/O pane. AAAA will do.
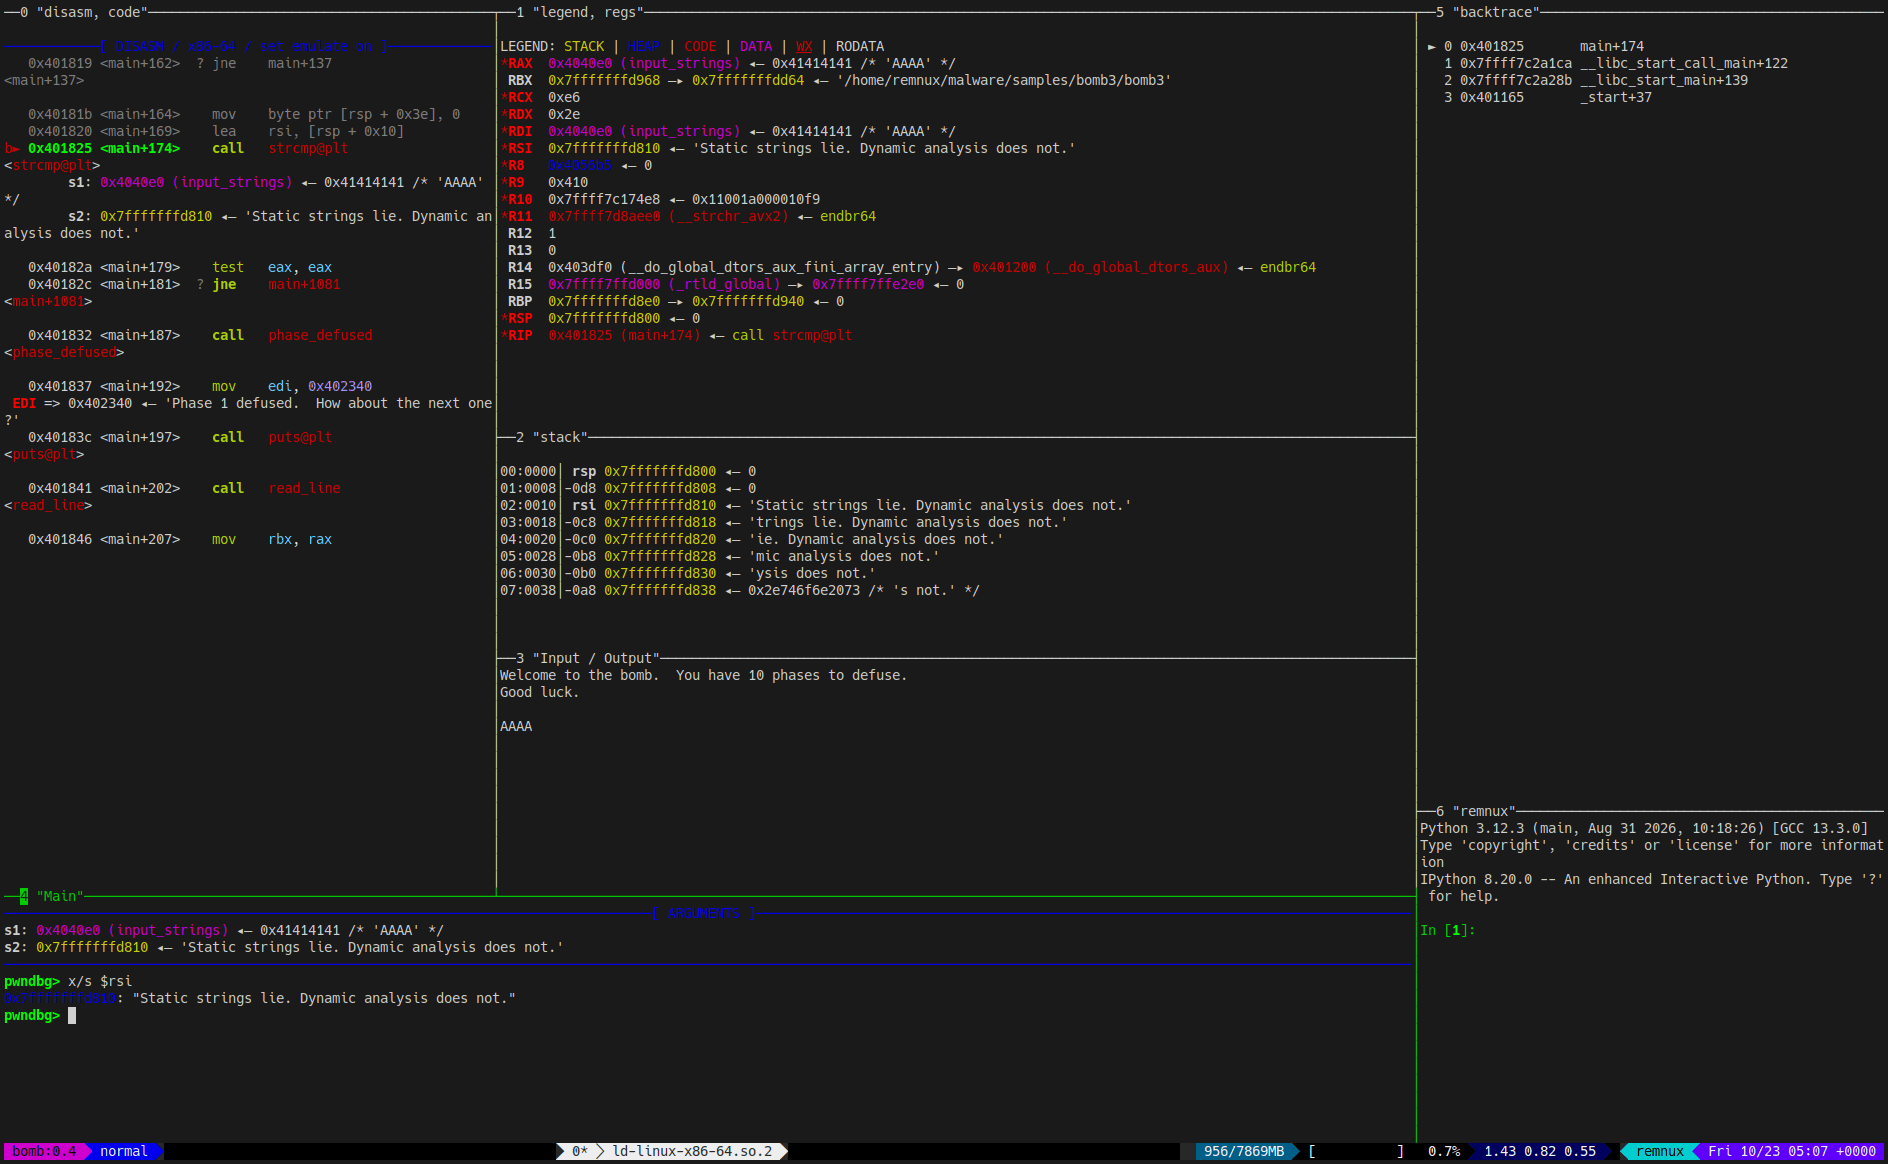
pwndbg recognises strcmp@plt and prints its arguments unprompted:
pwndbg> x/s $rsi
0x7fffffffd810: "Static strings lie. Dynamic analysis does not."
s1: 0x4040e0 (input_strings) ◂— 0x41414141 /* 'AAAA' */
s2: 0x7fffffffd810 ◂— 'Static strings lie. Dynamic analysis does not.'
The answer appears in four places at once — the ARGUMENTS block, RSI in the
register pane, the stack pane, and x/s. That redundancy is the layout earning its
keep.
Phase 1: Static strings lie. Dynamic analysis does not.
The string was assembled on the stack a few microseconds before the comparison, which
is why strings never had a chance. A packer does exactly this, with a bigger
payload.
Phase 2 — a function that undoes itself
Phase 2’s checks land at main+339. Walk back from it:
pwndbg> x/7i 0x4018b0
   0x4018b0 <main+313>:  mov    edx,eax
   0x4018b2 <main+315>:  shr    edx,0x8
   0x4018b5 <main+318>:  and    edx,0xff00ff
   0x4018bb <main+324>:  shl    eax,0x8
   0x4018be <main+327>:  and    eax,0xff00ff00
   0x4018c3 <main+332>:  or     eax,edx
   0x4018c5 <main+334>:  cmp    eax,0xcafec001
Scroll up from there and the rest of the pattern is unmistakable: paired masked
shifts against 0x55555555/0xaaaaaaaa, then 0x33333333/0xcccccccc, then
0x0f0f0f0f/0xf0f0f0f0, then the 0x00ff00ff pair above. That is the
divide-and-conquer 32-bit bit reversal, and it is worth learning to recognise on
sight — swap adjacent bits, then pairs, then nibbles, then bytes.
Which leaves the constant — and here the obvious move is a trap. Reversing
0xcafec001, the value actually on screen, produces 0x80037f53, and the bomb
rejects it.
Count the steps to see why. The textbook idiom is five operations: the four masked
shift-pairs above, then a final 16-bit rotation. The rotation is never emitted. The
compiler folded it into the comparison instead, because testing
partial(x) == 0xcafec001 is the same test as reverse(x) == 0xc001cafe — and
0xc001cafe is the constant the algorithm is really written around. (It also looks
deliberate, which is a fair hint on its own.)
So the target is 0xc001cafe, and a bit reversal is its own inverse: the answer is
0xc001cafe reversed. Rather than reimplement that, make the bomb compute it. Break
on the comparison and hand the routine the target:
pwndbg> break *0x4018c5
pwndbg> run
Phase 1 answer, then 0xC001CAFE for phase 2.
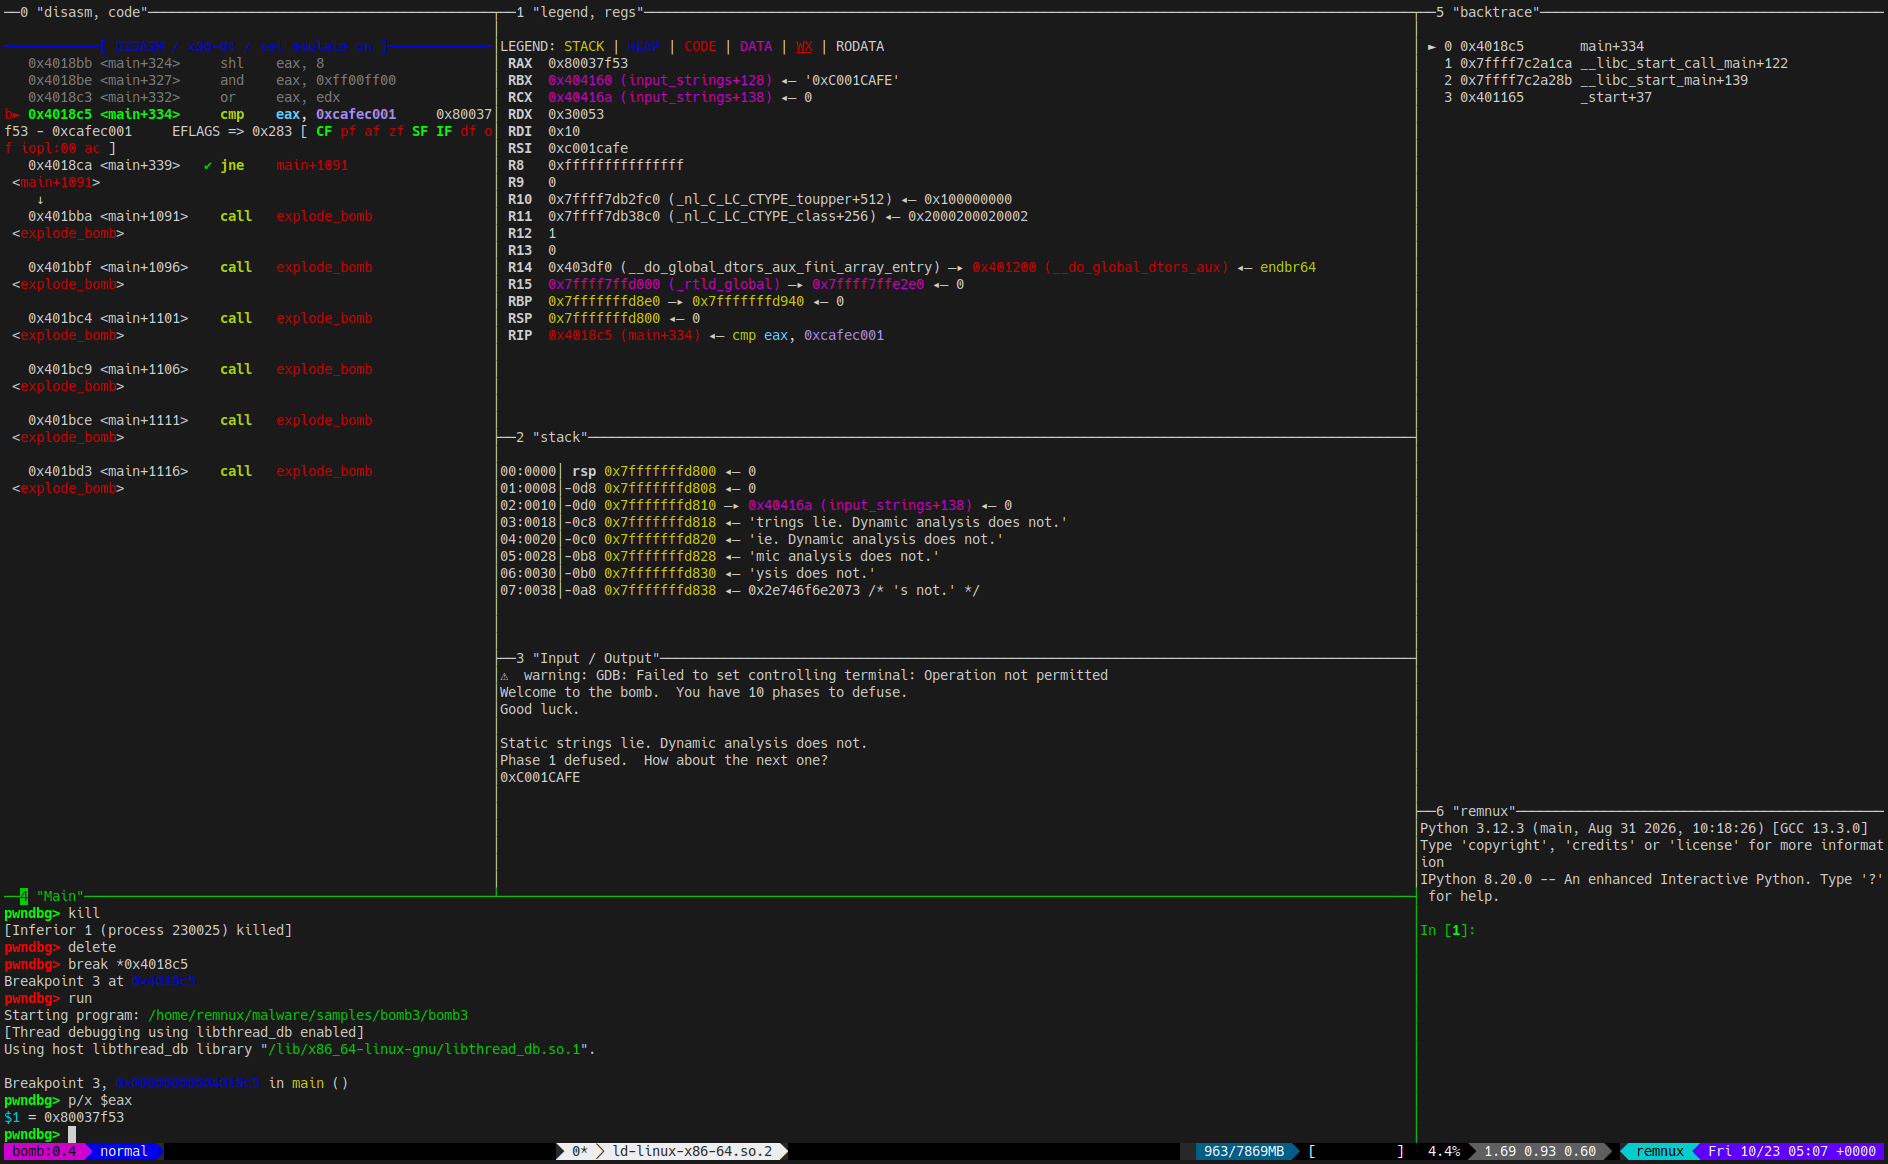
pwndbg> p/x $eax
$1 = 0x80037f53
$eax holds the four mask steps applied to 0xc001cafe — everything except the
rotation the compiler declined to emit. Supply that last step yourself by swapping
the halves, and you have the full reversal:
0x80037f53 -> 0x7f538003
That is the same missing rotation as before, showing up in the result this time
instead of in the constant. If you would rather not do it in your head, the IPython
pane is right there: hex(((0x80037f53 >> 16) | (0x80037f53 << 16)) & 0xFFFFFFFF).
0x7f538003 is 2136178691. The bomb accepts either form; strtoul is called with
base 0, so a 0x prefix is parsed as hex.
Phase 2: 2136178691
Phase 3 — recovering the shape of an array
Phase 3 calls sscanf at main+393, and the checks that follow are a clean little
specification:
pwndbg> x/14i 0x401905
   0x401905 <main+398>:  cmp    eax,0x3          ; sscanf matched 3 fields?
   0x401908 <main+401>:  jne    0x401bbf
   0x40190e <main+407>:  mov    edx,DWORD PTR [rsp+0x8]
   0x401912 <main+411>:  cmp    edx,0x4          ; first value  <= 4  (unsigned)
   0x401915 <main+414>:  ja     0x401bc4
   0x40191b <main+420>:  mov    ecx,DWORD PTR [rsp+0xc]
   0x40191f <main+424>:  cmp    ecx,0x6          ; second value <= 6  (unsigned)
   0x401922 <main+427>:  ja     0x401bc4
   0x401928 <main+433>:  lea    eax,[rdx+rcx*1]
   0x40192b <main+436>:  cmp    eax,0x8          ; the two must sum to 8
   0x40192e <main+439>:  jne    0x401bc9
   0x401934 <main+445>:  lea    eax,[rdx*8+0x0]
   0x40193b <main+452>:  sub    eax,edx          ; eax = 8*row - row = 7*row
   0x40193d <main+454>:  add    eax,ecx          ; eax = 7*row + col
Check the format string to confirm the field count:
pwndbg> x/s 0x40215d
0x40215d:       "%d %d %d"
Three integers. The first is bounded at 4, the second at 6, and they must sum to 8.
Then comes the address arithmetic, and lea eax,[rdx*8] followed by sub eax,edx is
the compiler’s way of writing row * 7 without a multiply — recognising that idiom
is the whole phase. A stride of 7 means seven columns per row, and the final
compare names the base:
0x401945 <main+462>: cmp DWORD PTR [rax*4+0x402520],ebx
Scale 4 (four-byte ints), base 0x402520 — which readelf already told us is
grid, 140 bytes. 140 ÷ 4 = 35 elements, 35 ÷ 7 = 5 rows, and that agrees with
the bound of 4 on the first field. The array is 5 × 7, so cast it and print it:
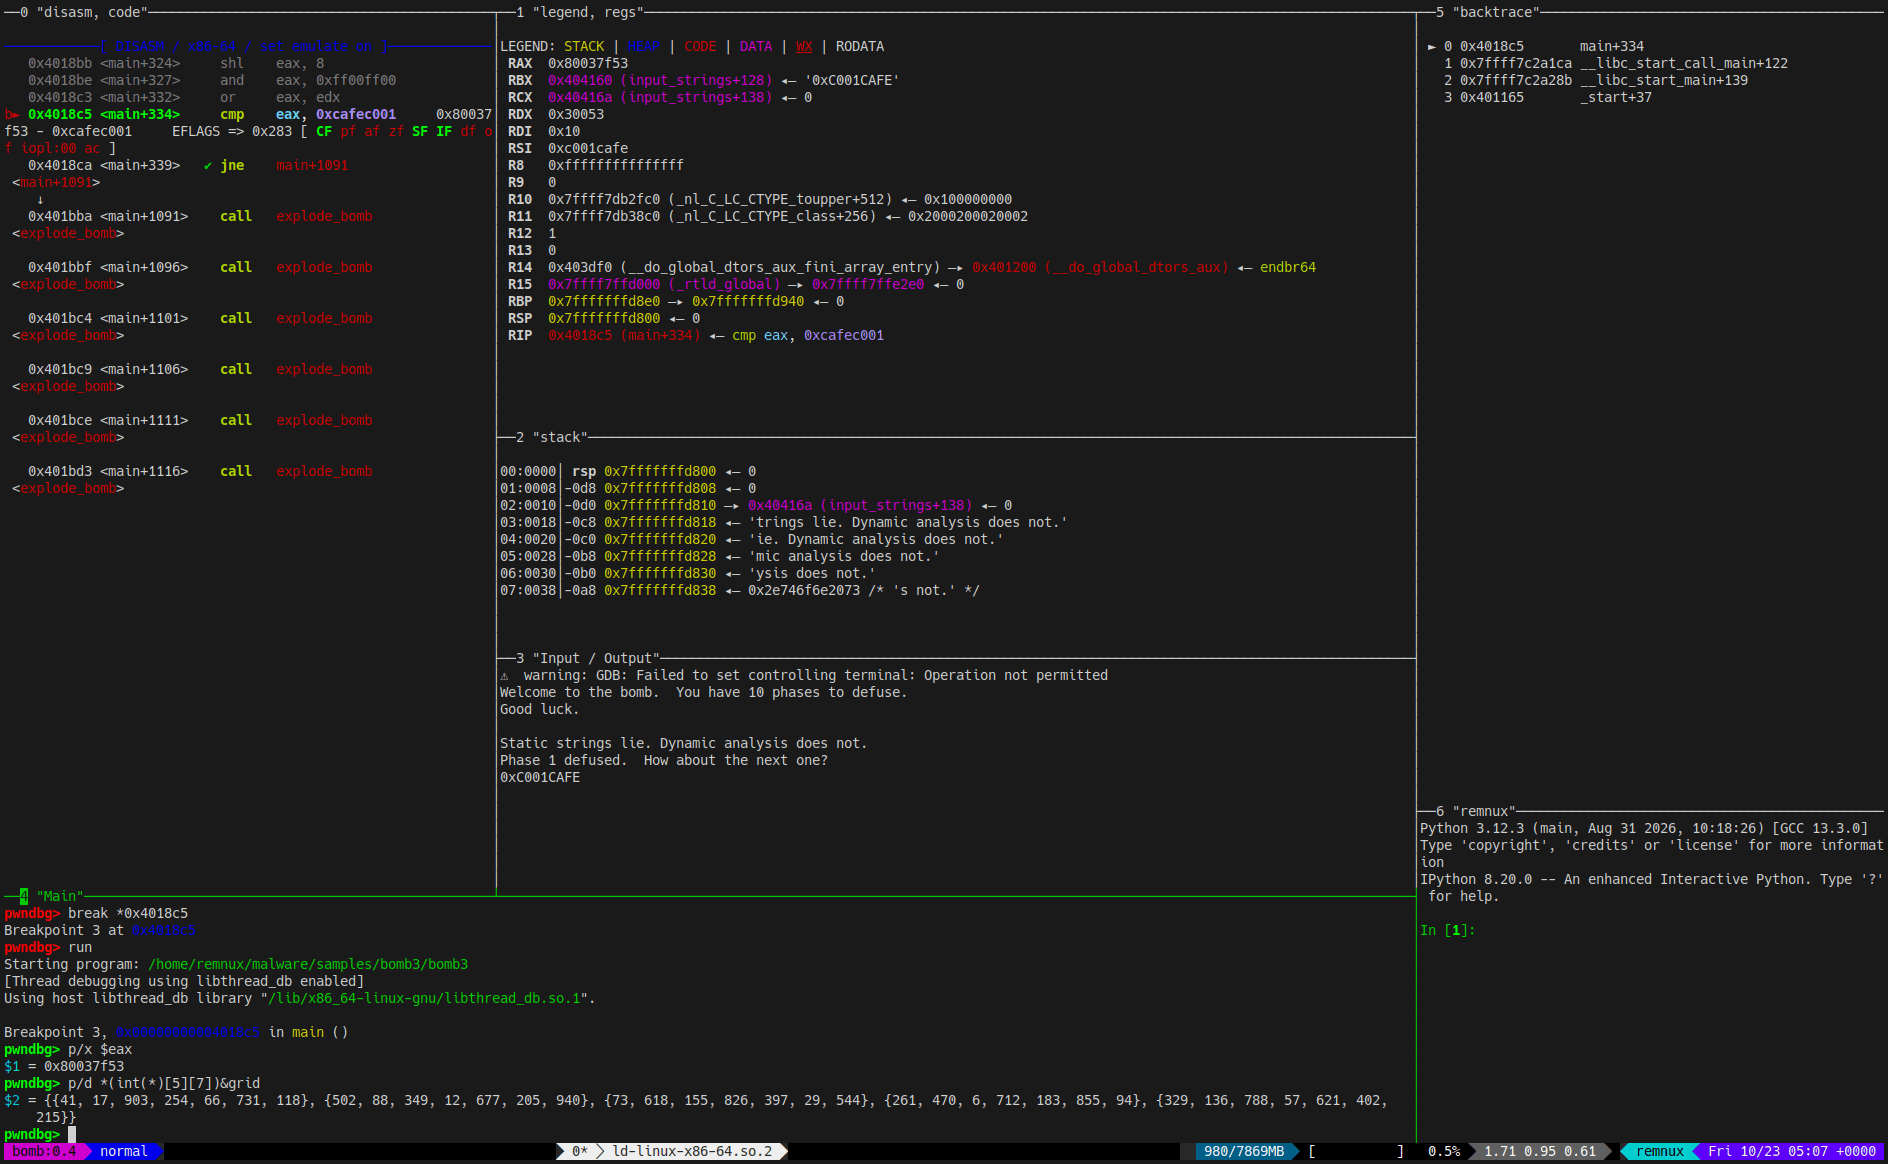
pwndbg> p/d *(int(*)[5][7])&grid
$2 = {{41, 17, 903, 254, 66, 731, 118},
      {502, 88, 349, 12, 677, 205, 940},
      {73, 618, 155, 826, 397, 29, 544},
      {261, 470, 6, 712, 183, 855, 94},
      {329, 136, 788, 57, 621, 402, 215}}
The /d is not optional if you printed anything in hex earlier in the session — gdb
remembers the last format you used and will apply it here.
Now solve the constraint. Row ≤ 4, column ≤ 6, and row + column = 8, which admits exactly three cells:
| row | col | grid[row][col] |
|---|---|---|
| 2 | 6 | 544 |
| 3 | 5 | 855 |
| 4 | 4 | 621 |
Any of the three is accepted.
Phase 3: 2 6 544
Phase 4 — a state machine, and a table with a stride of 3
Phase 4 starts by rejecting anything that is not eight characters long, then runs a loop one character at a time:
pwndbg> x/12i 0x401987
   0x401987 <main+528>:  movsx  eax,BYTE PTR [rcx]
   0x40198a <main+531>:  sub    eax,0x61
   0x40198d <main+534>:  cmp    eax,0x2
   0x401990 <main+537>:  ja     0x401bd8 <main+1121>
   0x401996 <main+543>:  cdqe
   0x401998 <main+545>:  movzx  edx,dl
   0x40199b <main+548>:  lea    rdx,[rdx+rdx*2+0x402500]
   0x4019a3 <main+556>:  movzx  edx,BYTE PTR [rdx+rax*1]
   0x4019a7 <main+560>:  cmp    dl,0x5
   0x4019aa <main+563>:  je     0x401bdd <main+1126>
   0x4019b0 <main+569>:  add    rcx,0x1
   0x4019b4 <main+573>:  cmp    rcx,rsi
Every line of the specification is in there. sub eax,0x61 turns the character into
an index and cmp eax,0x2 / ja restricts it to 0, 1, or 2 — so the alphabet is a,
b, c. lea rdx,[rdx+rdx*2+0x402500] is the same trick as phase 3’s ×7, one
size down: rdx*3 plus a base, so the table has a stride of 3 and dl carries
the running state. movzx edx,BYTE PTR [rdx+rax] is table[state][symbol], one byte
per entry. Then cmp dl,0x5 / je detonates on state 5, and after the loop:
   0x4019b9 <main+578>:  cmp    dl,0x4
   0x4019bc <main+581>:  jne    0x401be2 <main+1131>
State 5 is a trap, state 4 is the only accepting state, and the base 0x402500 is
dfa — 18 bytes from readelf, which at 3 bytes per row is 6 states. pwndbg will
even name it for you in the disassembly pane: RDX => 0x402500 (dfa).
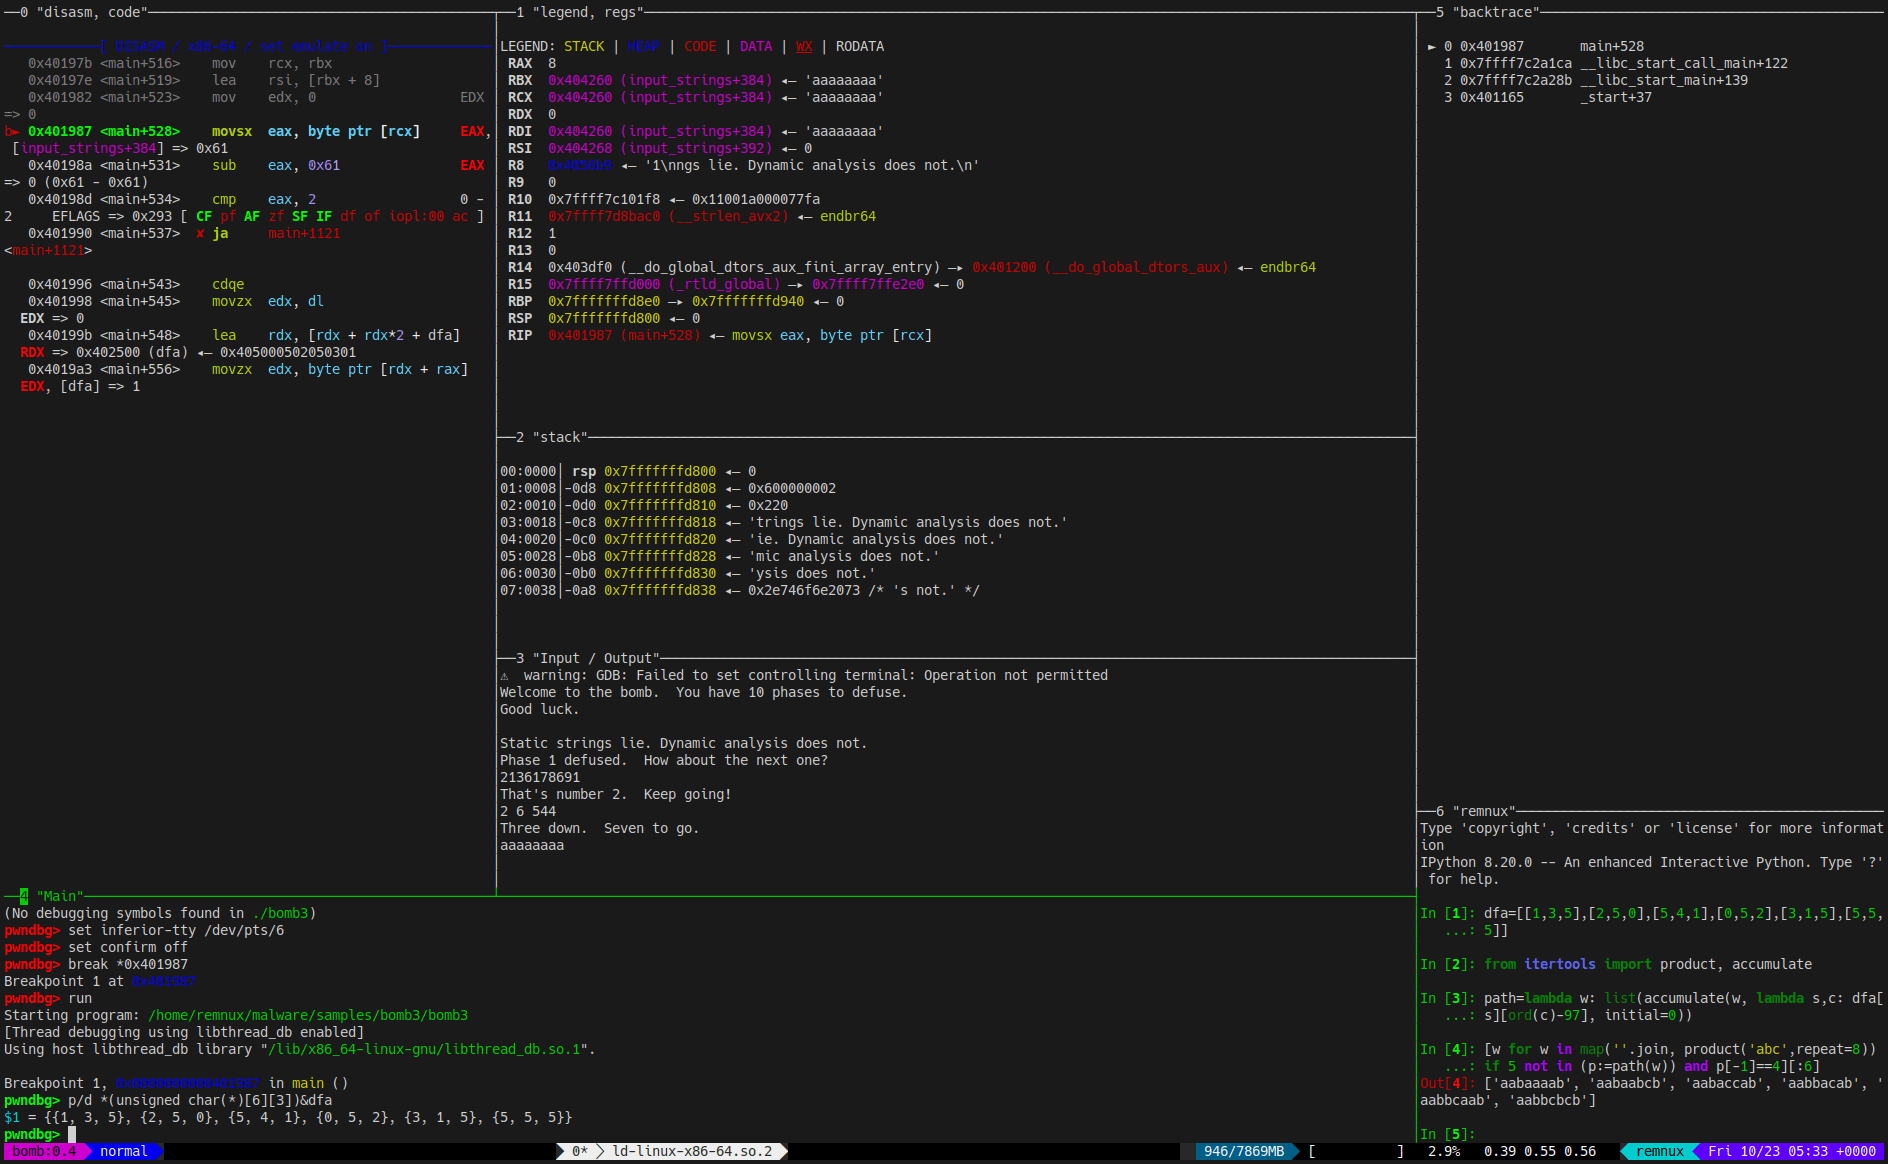
pwndbg> p/d *(unsigned char(*)[6][3])&dfa
$1 = {{1, 3, 5}, {2, 5, 0}, {5, 4, 1}, {0, 5, 2}, {3, 1, 5}, {5, 5, 5}}
| state | a |
b |
c |
|---|---|---|---|
| 0 (start) | 1 | 3 | 5 |
| 1 | 2 | 5 | 0 |
| 2 | 5 | 4 | 1 |
| 3 | 0 | 5 | 2 |
| 4 (accept) | 3 | 1 | 5 |
| 5 (trap) | 5 | 5 | 5 |
There are only 3⁸ = 6561 candidate words, so there is no need to be clever. This is what the IPython pane is for — it is already running next to the debugger, and it can see nothing of the process, which is fine because the table is now just data:
In [1]: dfa=[[1,3,5],[2,5,0],[5,4,1],[0,5,2],[3,1,5],[5,5,5]]
In [2]: from itertools import product, accumulate
In [3]: path=lambda w: list(accumulate(w, lambda s,c: dfa[s][ord(c)-97], initial=0))
In [4]: [w for w in map(''.join, product('abc',repeat=8)) if 5 not in (p:=path(w)) and p[-1]==4][:6]
Out[4]: ['aabaaaab', 'aabaabcb', 'aabaccab', 'aabbacab', 'aabbcaab', 'aabbcbcb']
Twenty-four words are accepted. Take the first, and trace it to check the reasoning:
path('aabaaaab') is [0, 1, 2, 4, 3, 0, 1, 2, 4] — nine states for eight
transitions, never touching 5, finishing on 4.
Phase 4: aabaaaab
Phase 5 — calling the bomb’s own functions
Phase 5 is the shortest phase in the bomb and the one that best rewards a debugger:
pwndbg> x/8i 0x4019ed
   0x4019ed <main+630>:  cmp    eax,0x1
   0x4019f0 <main+633>:  jne    0x401be7 <main+1136>
   0x4019f6 <main+639>:  mov    edi,DWORD PTR [rsp+0x10]
   0x4019fa <main+643>:  cmp    edi,0xc8
   0x401a00 <main+649>:  ja     0x401bec <main+1141>
   0x401a06 <main+655>:  call   0x401264 <hof_male>
   0x401a0b <main+660>:  cmp    eax,0x2f
   0x401a0e <main+663>:  jne    0x401bf1 <main+1146>
One integer from sscanf, bounded at 0xc8 = 200 by an unsigned compare, passed to
hof_male, and the return value must be 0x2f = 47.
hof_male survived as a symbol, and reading it is deliberately unrewarding — it
calls hof_female, which calls hof_male, and neither base case tells you anything
on its own. You can untangle the recursion on paper. You can also decline to.
The function is sitting in the process, it takes one int and returns one int, and
gdb can call it. There is no DWARF, so supply the prototype in the cast:
pwndbg> p ((int(*)(int))hof_male)(76)
$1 = 47
Better: let gdb do the searching. Any stop inside a live process will do — the inferior has to be running for a call like this to be possible at all:
pwndbg> set $n = 0
pwndbg> while ((int(*)(int))hof_male)($n) != 47
 >set $n = $n + 1
 >end
pwndbg> printf "hof_male(%d) = 47\n", $n
hof_male(76) = 47
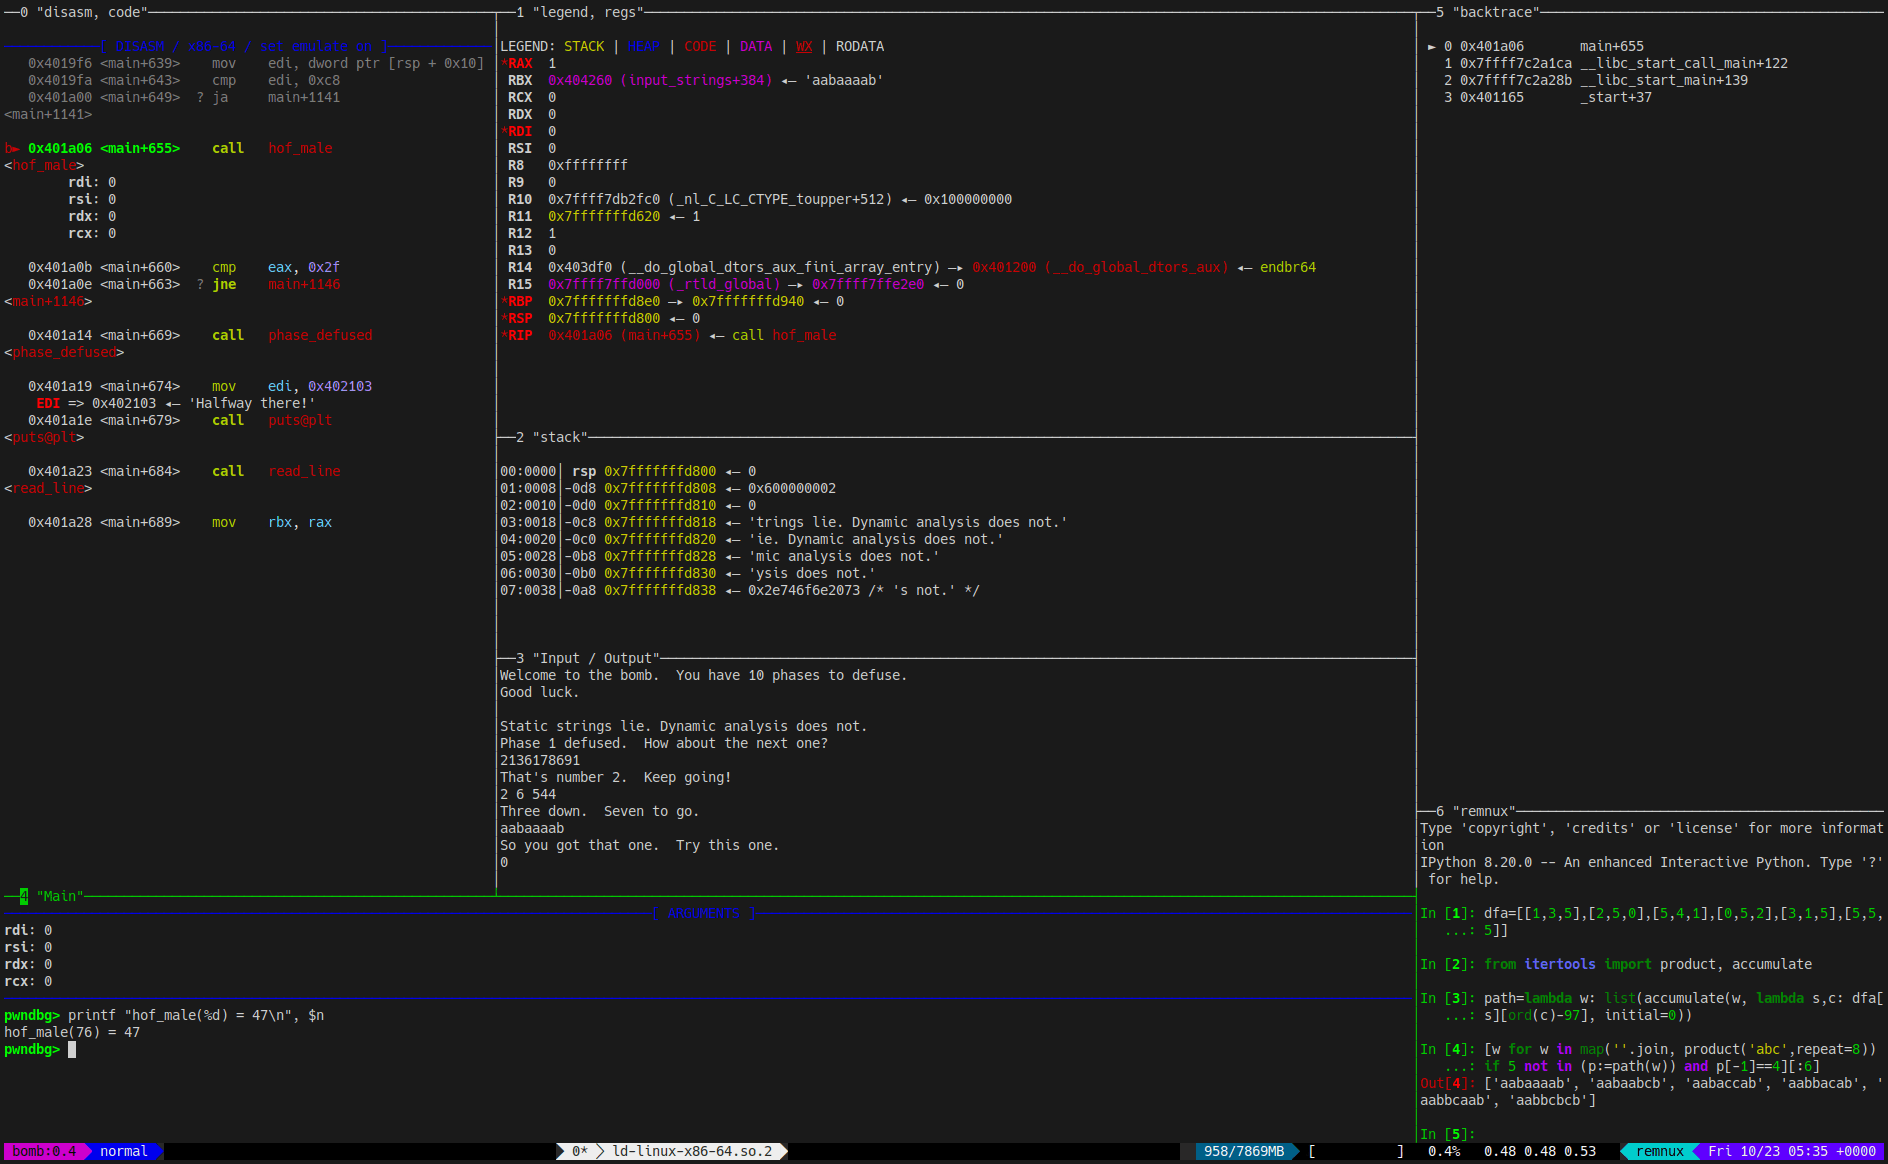
Nine seconds of brute force, and no understanding of the sequence required. (It is
Hofstadter’s mutually recursive Male and Female pair, if you want the name; M runs
0, 0, 1, 2, 2, 3, 4, 4, 5, 6, 6, 7, 7, 8, … and is non-decreasing, which is why the
search finds 76 and why 76 is the only answer in range.)
This is the sharpest version of the lesson phase 2 started. There, you fed the program a value and read what it computed. Here you ignore the program’s control flow entirely and use one of its functions as a subroutine of your own.
⚠️ Calling into the inferior runs real code. It executes on the process’s own stack, with its own globals, and a function that is not pure will change the state you are debugging.
hof_maleis arithmetic and safe. Do this to something that touches a file, a socket, or a global and you have altered the run you were trying to observe — and in a live malware sample, possibly done something much worse.
Phase 5: 76
All five, for real
Restart clean, no breakpoints, and type the five answers into the I/O pane:
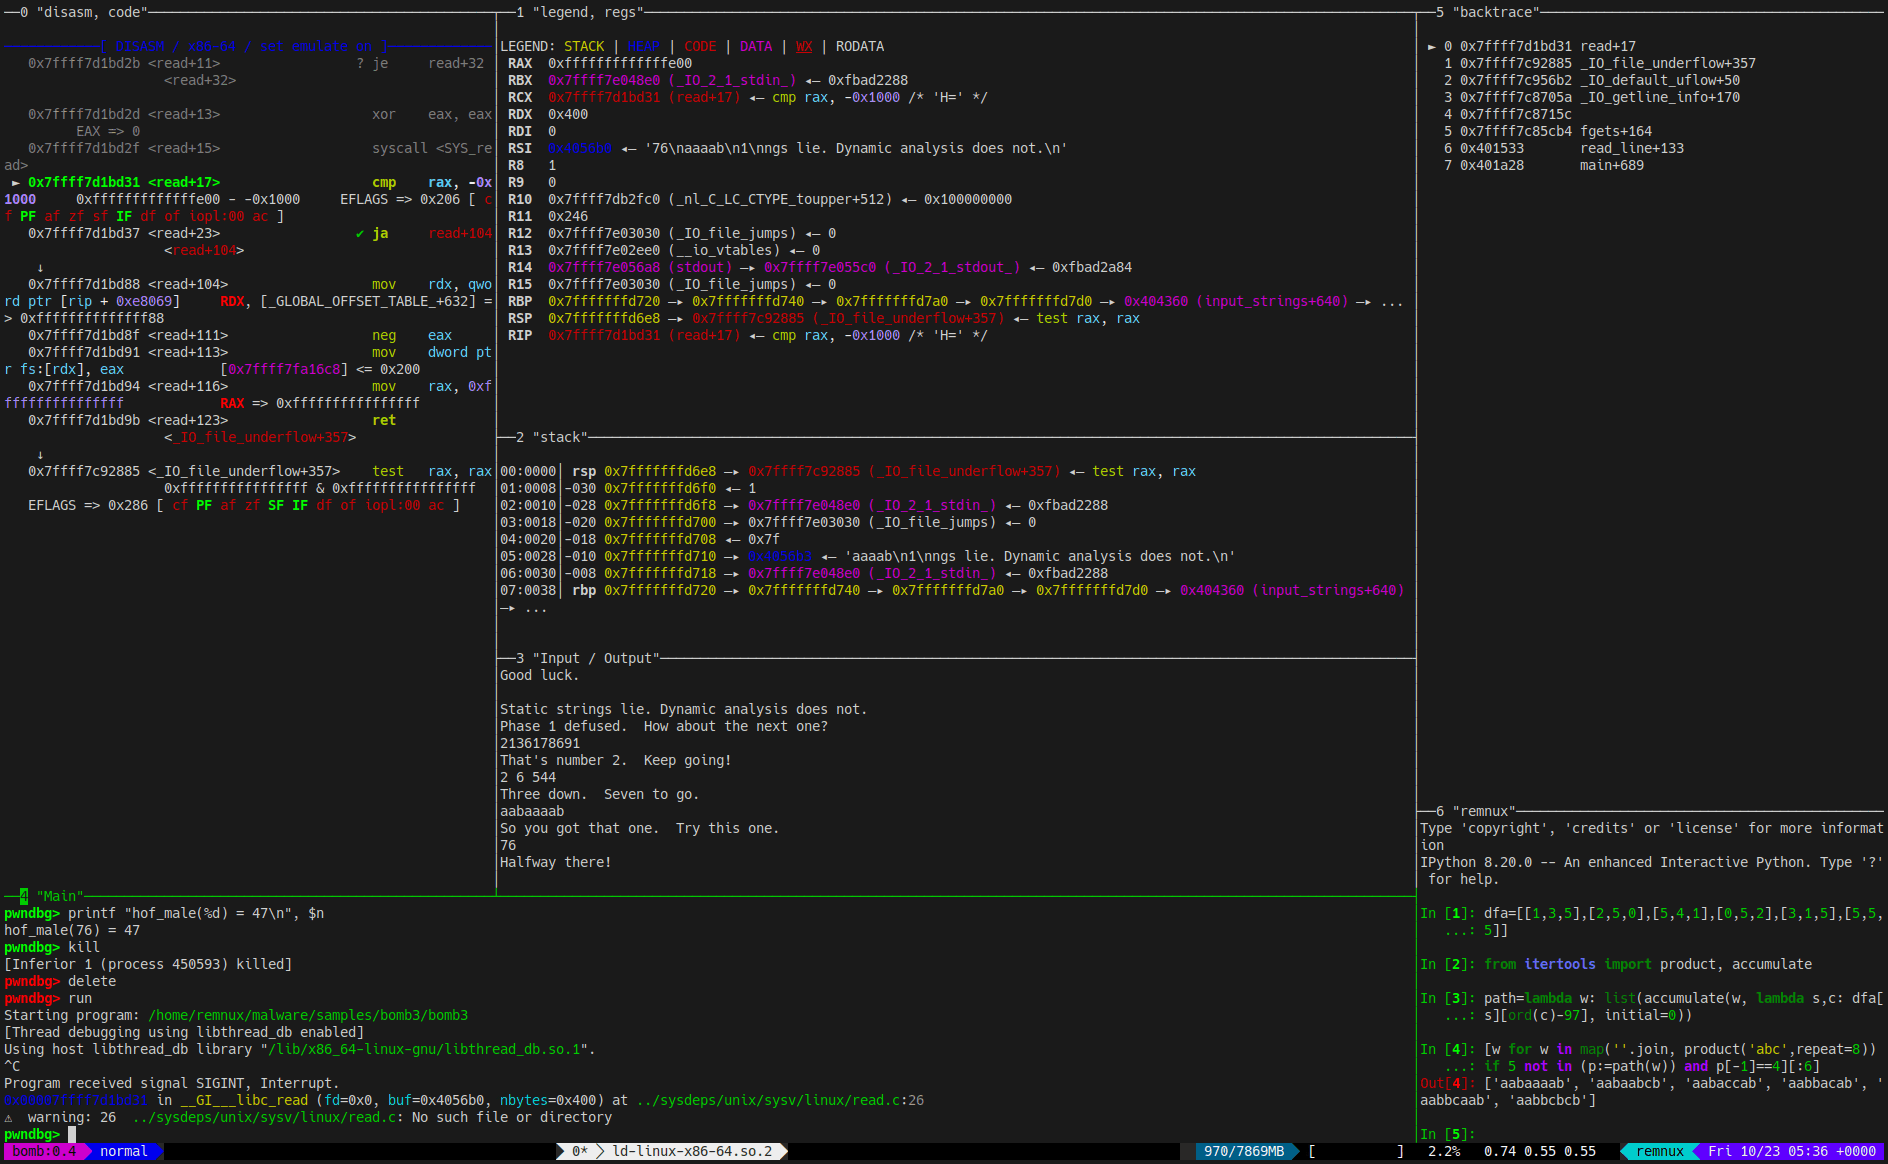
Welcome to the bomb.  You have 10 phases to defuse.
Good luck.

Static strings lie. Dynamic analysis does not.
Phase 1 defused.  How about the next one?
2136178691
That's number 2.  Keep going!
2 6 544
Three down.  Seven to go.
aabaaaab
So you got that one.  Try this one.
76
Halfway there!
The backtrace pane in that screenshot is worth one last look. The bomb is blocked
reading phase 6, and the stack reads fgets → read_line+133 → main+689. Not
phase_6 — main. The inlining we found during triage is visible at run time too.
🛠️ Interrupt to refresh. While the inferior is running, the context panes still show the last stop.
Ctrl-Cin the Main pane breaks in and repaints all of them against the live process — which is how the backtrace above was taken.
The other five are yours
Halfway. The remaining phases are the same job with the technique swapped out, and you now have every tool you need: break before the comparison, dump the table, cast what you print, and call the binary’s own code when it is easier than reading it.
One nudge each, and no more than one — the point is the hour you spend, not the answer:
Phase 6. It parses a float and then immediately stops treating it as one. There is no tolerance anywhere in the comparison, no arithmetic, nothing approximate. Work out what is actually being compared and the phase collapses into a formatting problem — the only real difficulty is printing your answer with enough digits to survive the round trip.
Phase 7. The call never names its target; it loads an address and calls through it, so the disassembly is a dead end at exactly the moment you want it to talk. Dump what it loads from, then ask gdb what lives at each of those addresses. You only have to satisfy one of them, so pick the one you would least mind searching by hand.
Phase 8. It reorders a small table and then checks the result is increasing — but not in the field you will reach for first. Read the comparison before you read the data, or you will sort the right records by the wrong key and never understand why a sensible-looking answer detonates.
Phase 9. The loop starts from a constant and multiplies by a small odd number each time round. That pair is a named algorithm, not something invented for this bomb; recognise it and you will know immediately that inverting it is not the move. Count how many inputs are actually legal before you assume brute force is too expensive.
Phase 10. Two puzzles stacked. The outer one is a loop that reads a structure and switches on a field — decode that before you look at anything else, because until you have the opcodes the inner program is noise. Once you can read it, note that every operation it performs can be undone, including the multiply: its constant is odd, and odd numbers are invertible modulo 2³². You do not have to search for the input.
And one more thing. The banner says ten phases. phase_defused is called after
every one of them, is 540 bytes long, and does considerably more than print a
congratulation. Read it — paying attention to which stored input line it goes back
and looks at a second time, and how many tokens it tries to pull out of it.
Transferring this to HW #3
HW #3 requires that you work entirely dynamically, and asks for the breakpoints and memory reads that actually produced each answer. The loop above is the answer to both:
| Step here | What it looks like on any bomb |
|---|---|
break explode_bomb + bt |
find the failure path before you understand the check |
| Return address → cold block | one call per failed check; map them to branches |
disassemble main + grep for the target |
the branch is the phase’s verdict |
| Break one instruction before the compare | let the program compute, then read a register |
readelf -s for data symbols |
sizes and addresses survive when functions do not |
| Cast before you print | no DWARF means you supply the type |
Two habits matter more than any single command. Break before the comparison, not after — once the branch is taken the computed value may already be gone. And let the program do the arithmetic: phase 1’s decode loop and phase 2’s bit reversal are both things you could reimplement by hand and both things the bomb will happily run for you.
Key takeaways
stringsis a starting point that phase 1 is designed to defeat. Anything built at run time — decoded, decrypted, unpacked — is invisible on disk. This is the same reason a packed sample’s strings tell you nothing.- “Not stripped” is not a map. Inlining removed every
phase_Nsymbol while leavingexplode_bomband the data objects. Check what symbols you actually got before planning around them. - Data symbols outlive code symbols.
readelf -sgave the address and size ofgridandp1_enc; the size is what turned 140 bytes into a 5 × 7 array. - Read the failure path first. You do not need to understand a check to break on the branch that fails it, and the branch tells you where the check is.
- Let the program compute. A self-inverse function, a decode loop, a hash — feed it the target and read the result rather than reimplementing it.
- The compiler rewrites arithmetic.
lea/subfor×7, and a rotation folded into a comparison constant. Expect the constant on screen not to be the constant in the algorithm. - A debugger answers “what did it do”, not “what will it do”. Every answer here is one observation. The static walkthrough is the other half of the skill.
- Addresses belong to a build, not to a program. Non-PIE buys you stability
across runs, not across compilers — a GCC patch release moved every address on
this page. Break on names, and derive the hex from your own
nm,bt, anddisassemble. Any analysis that only works when the literals match was never analysis.
References
- pwndbg — documentation and install. https://pwndbg.re/
- pwndbg — source and issue tracker. https://github.com/pwndbg/pwndbg
- splitmind — the tmux pane layout driver pwndbg uses. https://github.com/jerdna-regeiz/splitmind
- GDB manual — breakpoints,
x, and expression evaluation. https://sourceware.org/gdb/current/onlinedocs/gdb.html - GDB manual —
pipe, the-ddelimiter, and$_shell_exitcode. https://sourceware.org/gdb/current/onlinedocs/gdb.html/Shell-Commands.html readelf(1)— symbol table dumps. https://man7.org/linux/man-pages/man1/readelf.1.html- Computer Systems: A Programmer’s Perspective, Bryant and O’Hallaron — the binary bomb lab’s origin. https://csapp.cs.cmu.edu/
- Sean Eron Anderson, Bit Twiddling Hacks — the bit-reversal idiom in phase 2. https://graphics.stanford.edu/~seander/bithacks.html#ReverseParallel
- tmux manual. https://man7.org/linux/man-pages/man1/tmux.1.html
Related course pages: Dynamic Analysis · Advanced Dynamic Analysis · Ghidra Static Walkthrough · Reverse Engineering · tmux · HW #3
🛠️ Maintenance note: every address, register value, and block of output on this page was produced against a
bomb3built from the instructor copy ofbomb3.cwith GCC 16.1.1, run on REMnux (Ubuntu 24.04) under pwndbg 2026.10.22 with its bundled GDB 18.1, in tmux 3.4. The screenshots are real captures of that session at 235×67.The one exception is the
pipetriage block, which was run against the same committedbomb3on the instructor workstation — pwndbg 2026.09.15 with GDB 18.1 — rather than on the REMnux VM. Its symbol addresses match thereadelftable above exactly, so the two sessions are interchangeable.The compiled binaries are no longer tracked — they are build output of the
.candMakefilebeside them, somakerecreates them. A rebuild shifts every address, including across a compiler patch release: GCC 16.2.1, three weeks after 16.1.1, movesexplode_bombfrom0x4013f8to0x40153b. The page now says so up front and breaks on names rather than addresses, so this does not need fixing when the toolchain moves — but if you re-capture the screenshots, they will carry whatever addresses that build has, and the surrounding prose quotes a few of them.pwndbg’s context output also changes shape between releases, so a different version may not render the ARGUMENTS block the way phase 1 relies on — if it stops appearing,
x/s $rsiat the same breakpoint still works.