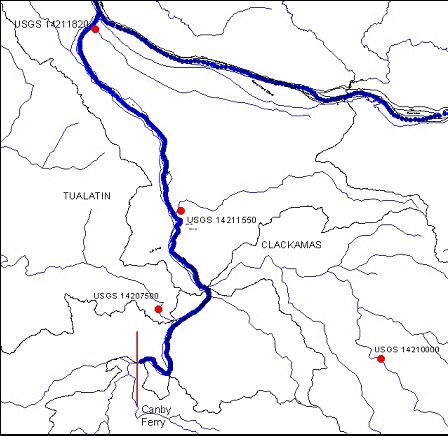
Figure 1. USGS gage
stations in the Willamette River Basin
Willamette River
Flow
The data set for the Willamette River tributaries
was obtained from the USGS gage stations shown in Table 1 and their locations
are shown in Figure 1. Input files for the model were developed using
continuous and daily data; however, correlations were also developed using
nearby stations to fill data gaps when they existed.
|
|
|
| USGS14211820 | Columbia Slough |
| USGS14211550 | Johnson Creek At Milwaukie |
| USGS14210000 | Clackamas River at Estacada |
| USGS14207500 | Tualatin River at West Linn |
Figure 1. USGS gage
stations in the Willamette River Basin
Tributary Inflows
The majority of the tributary inflows to the Columbia
and Willamette River were considered in the model. Nevertheless, a small
number of these tributaries were not characterized because flow information
was not available. Figure 2 shows in red the tributary inflows that were
not considered explicitly in the model. An analysis was conducted
using a Geographic Information System, which determined the total drainage
area not considered in the model was about 0.34%. The analysis considers
the entire Columbia River basin above Bonneville Dam which is not shown
in Figure 2.
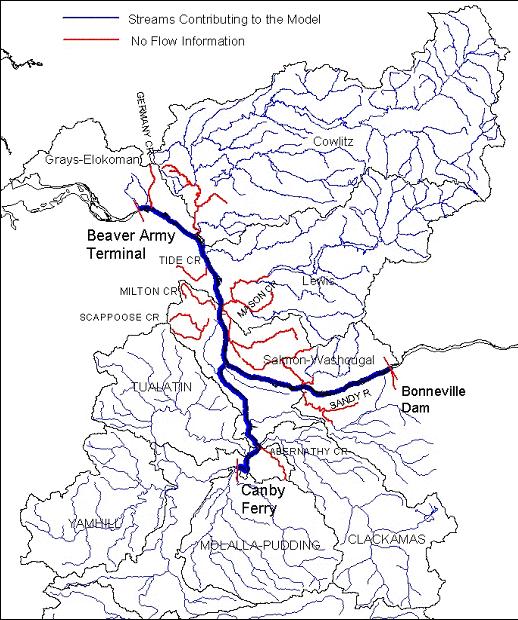
Figure 2. Columbia
and Willamette River tributary inflows
Columbia Slough flow data at the Lombard station (USGS: 14211820) and Johnson Creek flow data at Milwaukie (USGS: 14211820) are recorded continuously. The input files for CE-QUAL-W2 were created using the continuous data for the summers (May 1 to September 30) of 1993,1994, 1997,1998, and 1999. For the Johnson Creek station continuous data for the year 1997 was missing consequently daily data was used to fill in gaps for the model input file. Daily flow data for the Tualatin River gage station located at West Linn was also used to create input files for CE-QUAL-W2. Figure 3 through Figure 5 show flows in the Columbia Slough, Johnson Creek, and Tualatin River for the summer periods modeled.
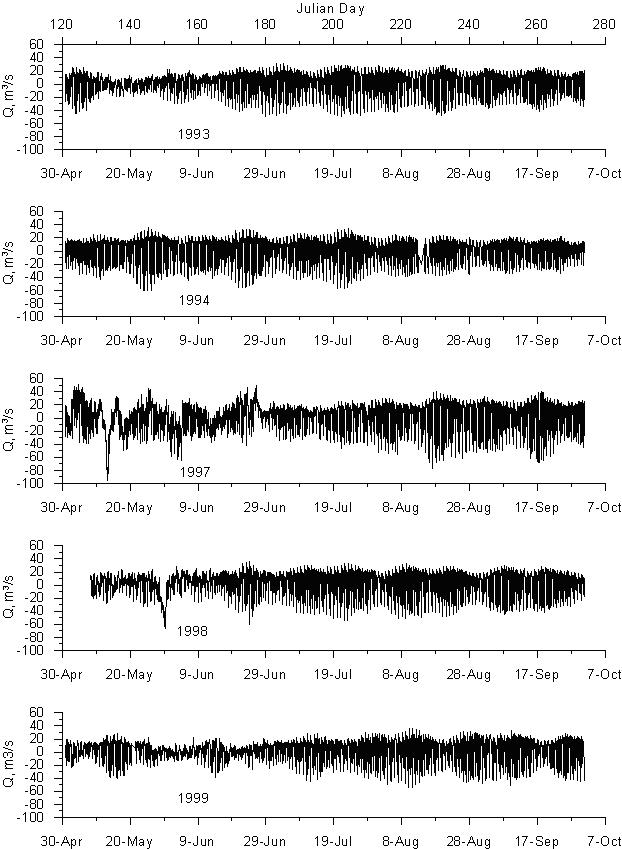
Figure 3. Columbia
Slough flow, m3/s
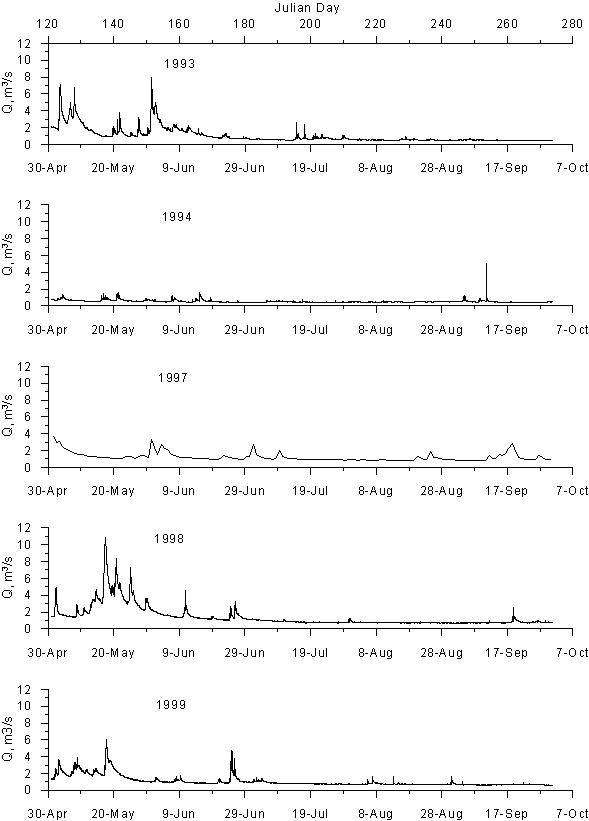
Figure 4. Johnson Creek
flow, m3/s
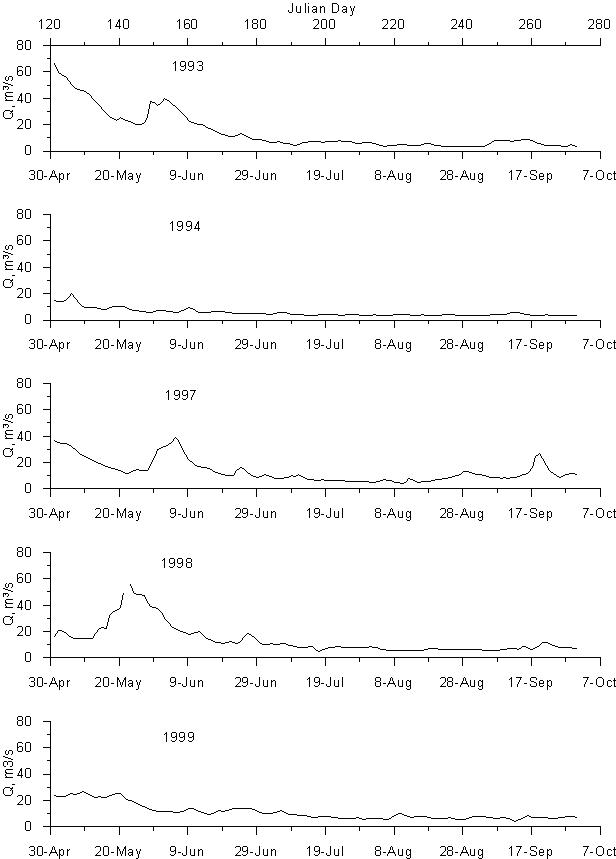
Figure 5. Tualatin
River flow, m3/s
The USGS gage station on the Clackamas River at Estacada (USGS: 14210000, RM 25.5) has recorded continuous flow data for the time periods modeled. A correlation was developed to obtain flows near the mouth of the Clackamas River using daily flow data from the Clackamas River station near Clackamas (USGS: 14211000) and daily data for the Clackamas station at Estacada from 10/01/1962 to 09/30/1983. The correlation relates daily flows between the two stations using the drainage areas as follows (R2 = 0.9852):
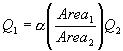
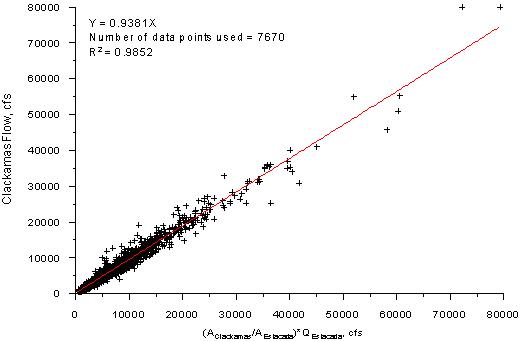
Figure 6. Clackamas
River near Clackamas and Clackamas River at Estacada Flow Correlation,
Year 1962 to 1983
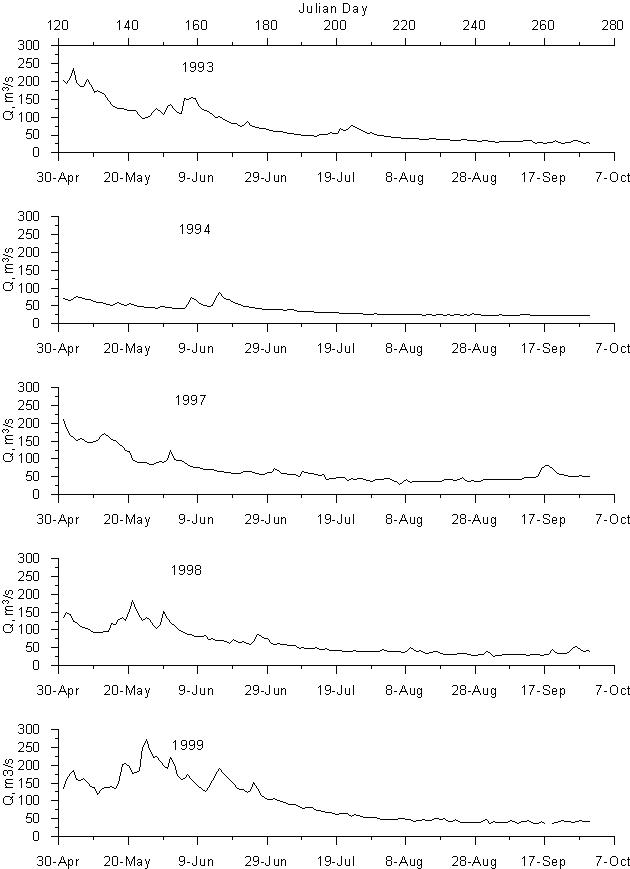
Figure 7. Clackamas
River flow, m3/s
Water Quality
Temperature and water Quality data for the Willamette River tributaries were obtained from the Oregon Department of Environmental Quality (DEQ), US Geological Survey (USGS), the City of Lake Oswego, and Metro. DEQ water quality data consist of grab samples that are taken at a frequency of monthly to twice a year. USGS measures continuous temperature in Johnson Creek at Milwaukie and continuous temperature, conductivity, dissolved oxygen, and pH in the Tualatin River near West Linn. The City of Lake Oswego collects water quality data in the Clackamas River (RM 0.3) every 4 hours. Some of the parameters measured are temperature, pH, alkalinity, conductivity, color, and turbidity. Metro has a continuous Hydrolab in the Columbia Slough that measures temperature, dissolved oxygen, dissolved oxygen saturation, conductivity, and pH.
Data provided by these agencies were combined to generate input files for the model. Figure 8 through Figure 11 show water temperature for the Willamette River tributaries.
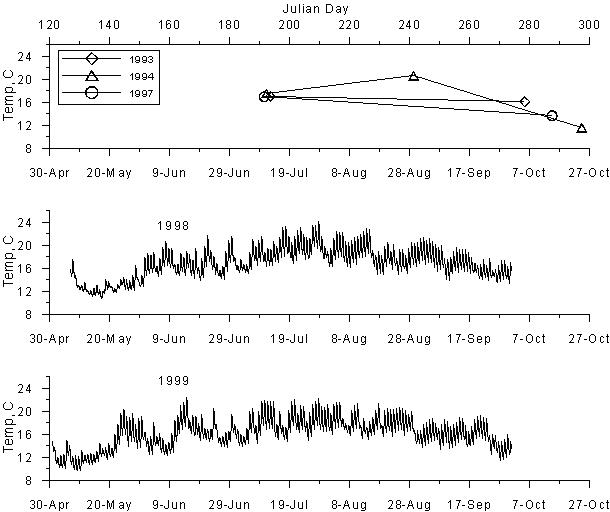
Figure 8. Johnson Creek water temperature, oC
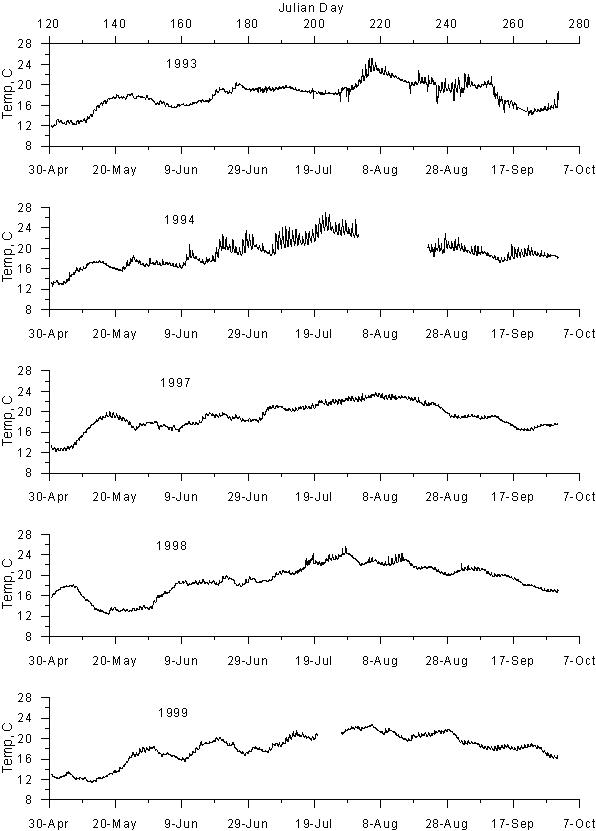
Figure 9. Tualatin River water temperature,
oC
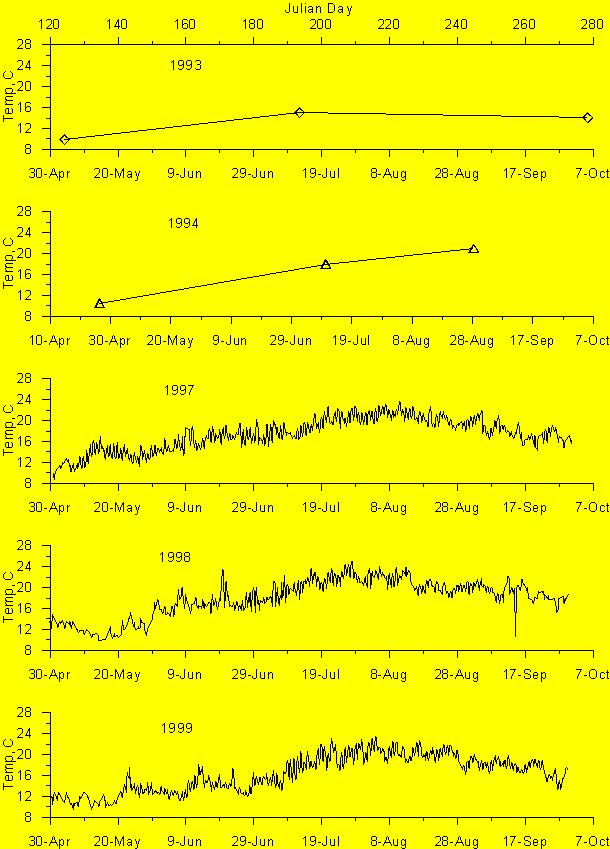
Figure 10. Clackamas River water temperature,
oC
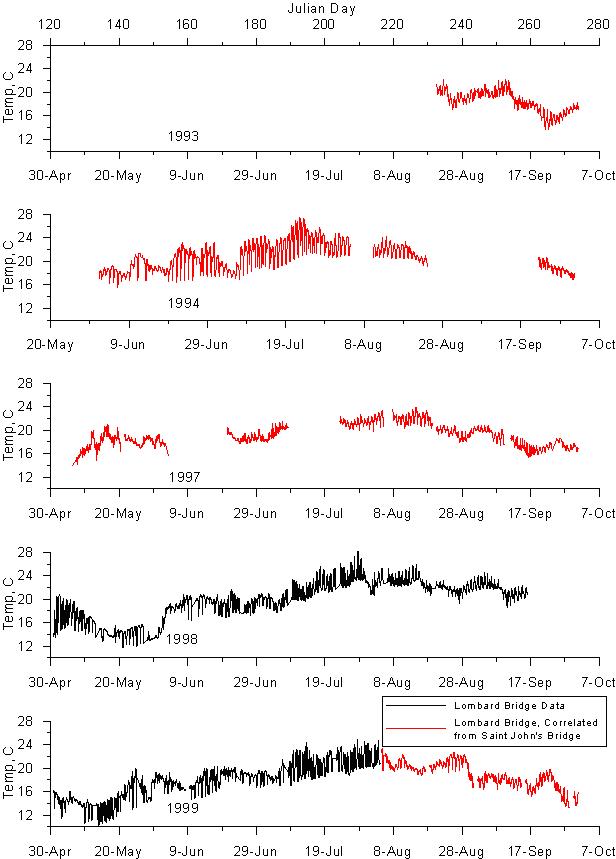
Figure 11. Columbia Slough water temperature,
oC
Columbia River
Flow
The major tributaries into the Columbia River,
excluding the Willamette itself, are identified in Table 2. Flow data for
these tributaries was obtained from USGS gage stations and from the Washington
State Department of Ecology (WADOE). Figure 12 shows the locations of the
USGS and WADOE stations used to develop the input files for CE-QUAL-W2.
The Washington State Department of Ecology conducted
a study to characterize baseflows for rivers and streams in Washington
(Sinclair and Pitz, 1999). Table 2 shows six stations in the State of Washington
where monthly baseflows were estimated and recent flow measurements were
not available. These stations were used to develop input flows for the
model.
|
|
|
| USGS14142500 | Sandy River Below Bull Run River, OR |
| USGS14143500 | Washougal River Near Washougal, WA |
| USGS14144000 | Little Washougal River Near Washougal, WA |
| USGS14220500 | Lewis River at Ariel, WA |
| USGS14243000 | Cowlitz River at Castle Rock, WA |
| WSDE14246000 | Abernathy Creek near Longview, WA |
| WSDE14246500 | Mill Creek near Cathlamet, WA |
| WSDE14243500 | Delameter Creek near Castle Rock, WA |
| WSDE14245000 | Coweman River near Kelso, WA |
| WSDE14223500 | Kalama River below Italian Creek near Kalama, WA |
| WSDE14221500 | Cedar Creek near Ariel, WA |
Tributary Inflows
The inflow to the Columbia River from the Grays-Elokoman basin was characterized by adding baseflows for the Abernathy Creek near Longview and Mill Creek near Cathlamet, Figure 12. The input file for the model was created using monthly averaged baseflows for the summer months modeled since no other data were available.
Inflows from the Kalama River were also characterized
using monthly baseflows estimated at the Kalama River near Kalama; shown
in Figure 12. As in the case of the Grays-Elokoman basin, the Kalama basin
was lacking data so the baseflows were used. Figure 12 shows the
flows for the Grays-Elokoman basin and the Kalama River for the summers
modeled.
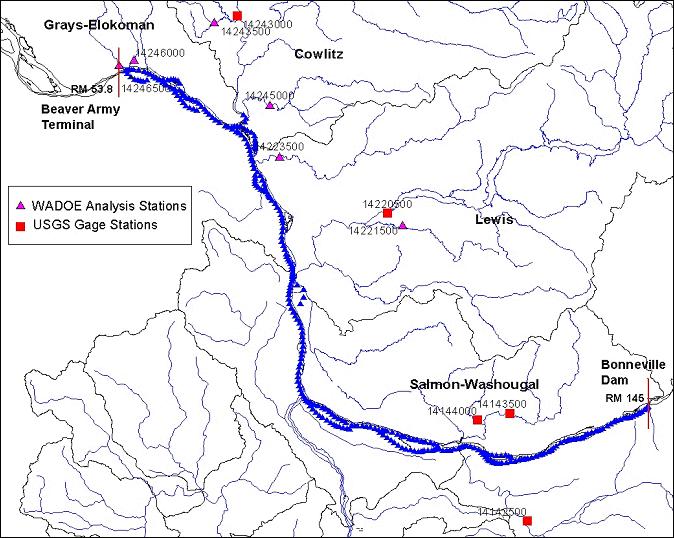
Figure 12. Columbia River Tributary gage
stations
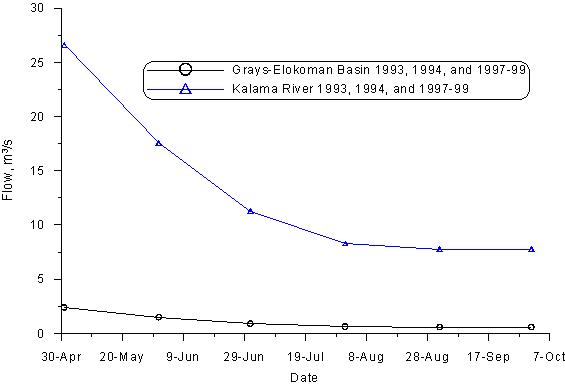
Figure 13. Grays-Elokoman Basin and Kalama
River flows, m3/s
The Cowlitz basin was characterized using continuous data for the Cowlitz
River station at Castle Rock (USGS: 14243000) for the summers of 1994,
and 1997 to 1999 and daily data for 1993 since there was a gap in the continuous
data. Figure 12 shows the Cowlitz basin and its tributaries. The
data from this station were added to the baseflows estimated at the Delameter
Creek station near Castle Rock and the Coweman River station near Kelso
to obtain the total Cowlitz basin inflow. Figure 14 shows flows for the
Cowlitz River for the modeled summer periods.
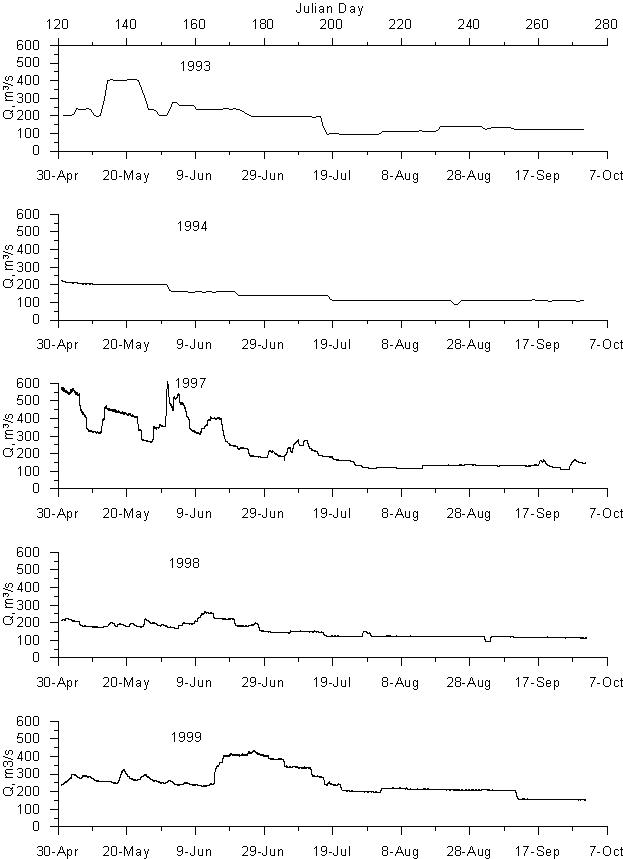
Figure 14. Cowlitz River flow, m3/s
The inflow from the Lewis basin was calculated adding daily average flows for the Lewis River station at Ariel and the East Fork of the Lewis River. Figure 12 shows the Lewis River Basin and its tributaries. Additionally, the baseflows from Cedar Creek were added in daily flows to generate the total inflow from the Lewis River Basin. Inflows to the Columbia River for the modeled periods are shown in Figure 15.
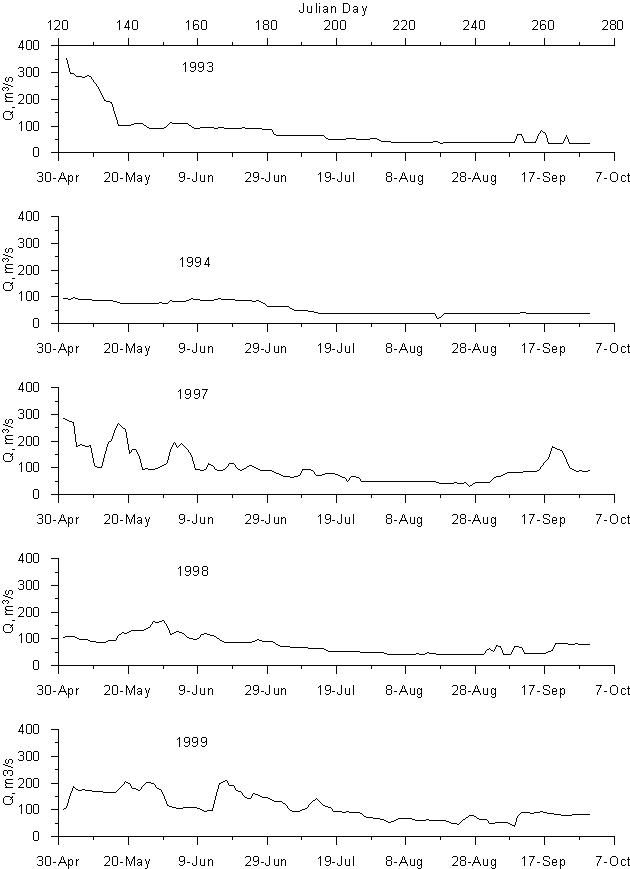
Figure 15. Lewis River flow, m3/s
The flow for the Washougal River was estimated based on correlations between the East Fork of the Lewis River and the Washougal River and the Little Washougal River. First, a correlation relating daily flows in the East Fork of the Lewis River with daily flows in the Washougal River was developed from the period 10/01/1944 to 9/30/1981. Figure 15 shows the Washougal and East Fork Lewis River Basins. Figure 16 shows flows in the Washougal River for the modeled time periods.
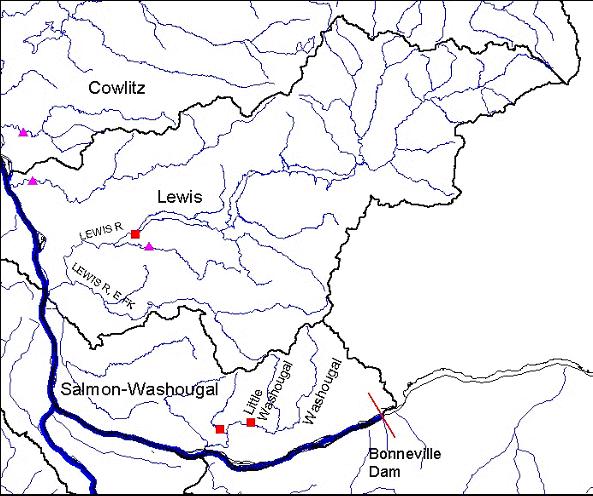
Figure 15. Lewis and Washougal River Basin
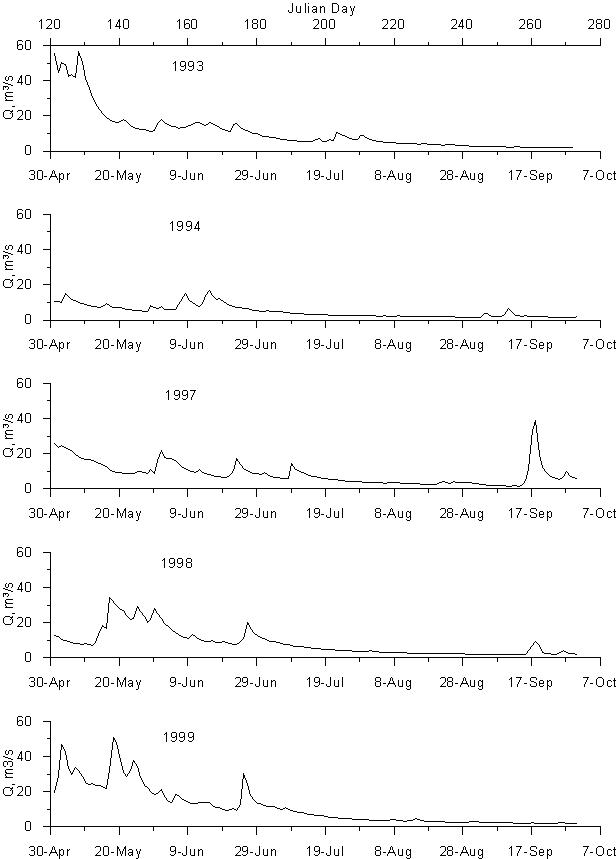
Figure 16. Washougal River flow, m3/s
The inflows from the Sandy River were characterized based on the USGS
gage station located below the confluence with the Bull Run River (USGS:
14142500). Continuous flow data for the summers of 1993 and 1997 to 1999
were used to generate the inflow files for the model. However for 1994
daily data were used because there was a gap in the continuous data record.
Sandy River flows for the summers modeled are shown in Figure 17.
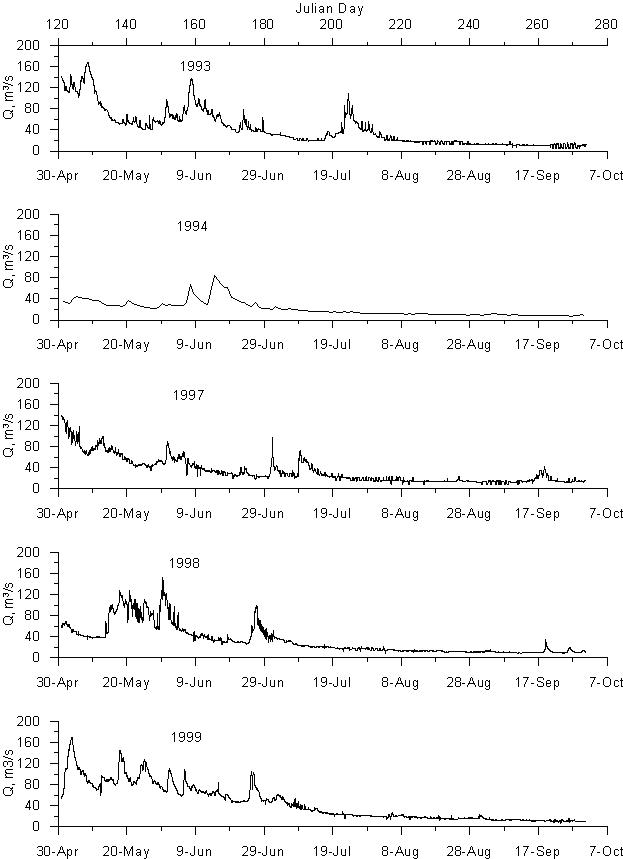
Figure 17. Sandy River flow, m3/s
Water Quality
The Department of Environmental Quality (DEQ) and the Washington Department of Ecology (WADOE) collect data on some of the tributaries flowing into the Columbia River. DEQ (STORET) water quality data consists of grab samples that are taken at a frequency of monthly to twice a year. Water quality data from WADOE (EIM) are taken on a monthly basis.
Water quality data from DEQ and WADOE were combined to generate the
input files for the model. Figure 18 shows the inflow temperature
for the Columbia River tributaries. In some cases no data were available
for a given year on a tributary so data from the year before or after was
used. In the case of the Grays-Elokoman basin, no temperature data
was available at all, so temperature data was used from the adjacent Cowlitz
River basin.
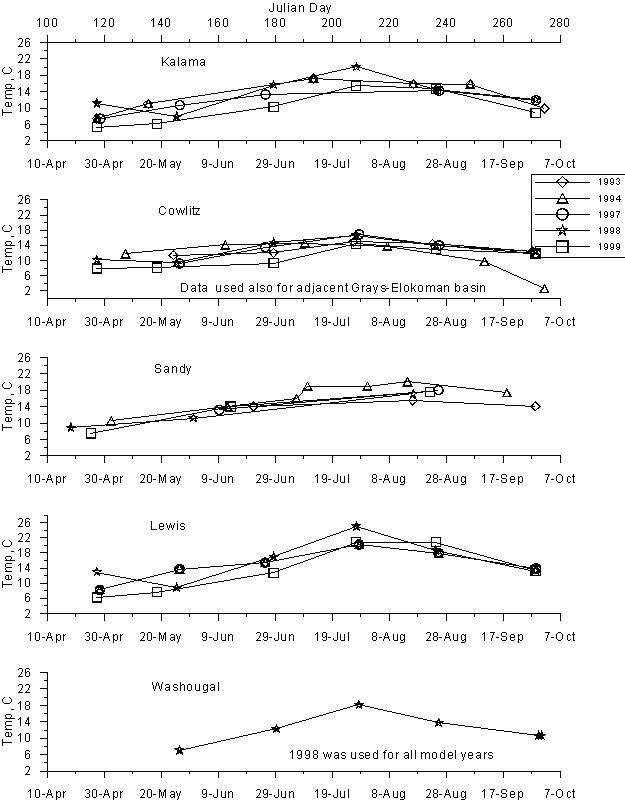
Figure 18. Washington Tributary water temperatures,
oC