Bull Run River Dye Study Project

CE 572/672 Environmental Fluid Mechanics I
Fall 2001
Scott A. Wells, Ph.D., P.E.
School of Engineering and Applied Science
Department of Civil Engineering
Portland State University
Portland, Oregon 97201-0751
Table of Contents *
Table of Figures *
Table of Tables *
Project Assignment *
Introduction *
Temperature Data in the River *
Bull Run River Dye Studies *
Bull Run River Dye Study June 16, 1999 *
Bull Run River Dye Study August 5, 1999 *
Dye Release 1 *
Dye Release 2 *
Dye Release 3 *
Dye Release 4 *
River Geometry *
Appendix A Dye Study Analysis Results (June 16, 1999) *
Appendix B Dye Study Analysis Results (August 5, 1999) *
Figure 1. Bull Run Watershed Topography *
Figure 2. Bull Run watershed in the Portland basin *
Figure 3. Bull Run Watershed System *
Figure 4. Thermopod Locations in the Lower Bull Run River *
Figure 5. Water Temperature in the Lower Bull Run River, September 1997 *
Figure 6. Dye Study Monitoring Locations, June 16, 1999 *
Figure 7. Dye Study Field Data *
Figure 8. Dye Releases and Monitoring Locations August 5, 1999 *
Figure 9. Measured flow at USGS Station August 5, 1999 *
Figure 10. Field Data for Dye Release 1 *
Figure 11. Field Data for Dye Release 2 *
Figure 12. Field Data for Dye Release 3 *
Figure 13. Field Data for Dye Release 4 *
Figure 14. Bull Run River below Reservoir #2. *
Figure 15. Longitudinal profile of the Lower Bull Run River water surface and river bottom *
Table 1. Thermopod Stations and Locations *
Table 2. Sample Sites *
Table 3. Dye Releases *
In this report 2 dye studies are described for the Lower Bull Run River in June and August of 1999. These dye studies were performed to calibrate a river model for temperature below the City of Portland Water supply reservoirs. Your assignment is to prepare a report that includes the following elements:
- Determine whether mass was conserved during the dye releases [From this, can you estimate a decay rate?]
- Determine the (approximate) cross-sectional area of the river [What assumptions do you have to make?]
- Determine the dispersion coefficient based on the field data [Was the dispersion coefficient a function of flow rate?]
- Use an analytical model to match dye concentrations in the river (constant A, EL, U)
- Use a numerical model to
match dye concentrations in the river using non-constant A, U, and EL
- Comment on the sources of error in your analysis and how a more refined analysis could be performed. What kind of field data would be necessary to refine the modeling study.
This assignment is due on the day of the final examination. Below is the background information for the project. Electronic versions of the data are on the web site for this class for downloading. The field data are in a zipped file: Bull_Run_Aug&June_dye_data.zip
The Bull Run River Reservoir System is a 102 mi2 watershed located 26 miles east of downtown Portland (Figure 1, Figure 2, and Figure 3). The watershed serves as the primary drinking water source for the City of Portland and some surrounding communities.
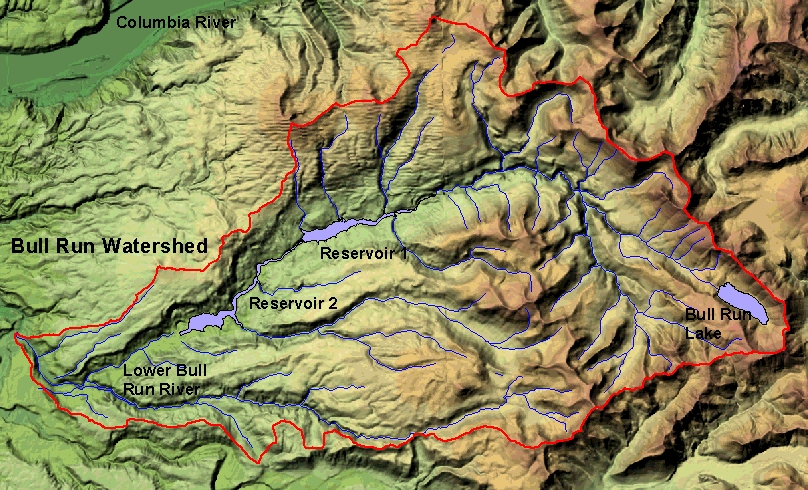
Figure 1.
Bull Run Watershed Topography
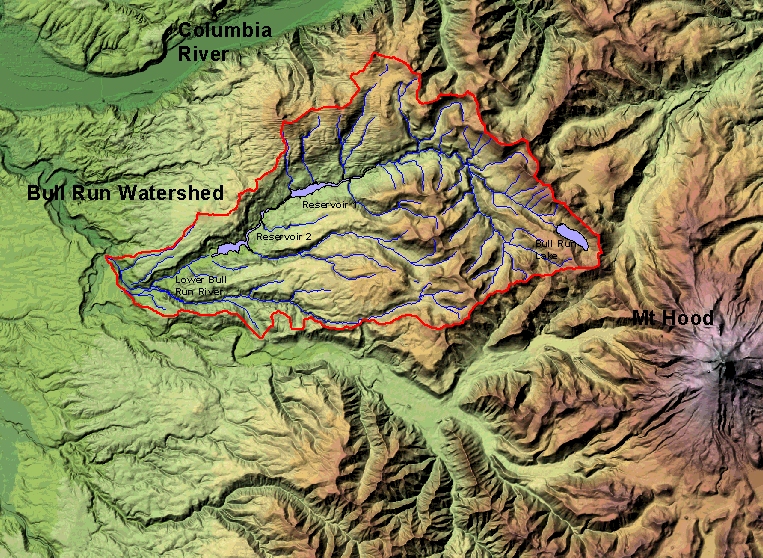
Figure 2.
Bull Run watershed in the Portland basin
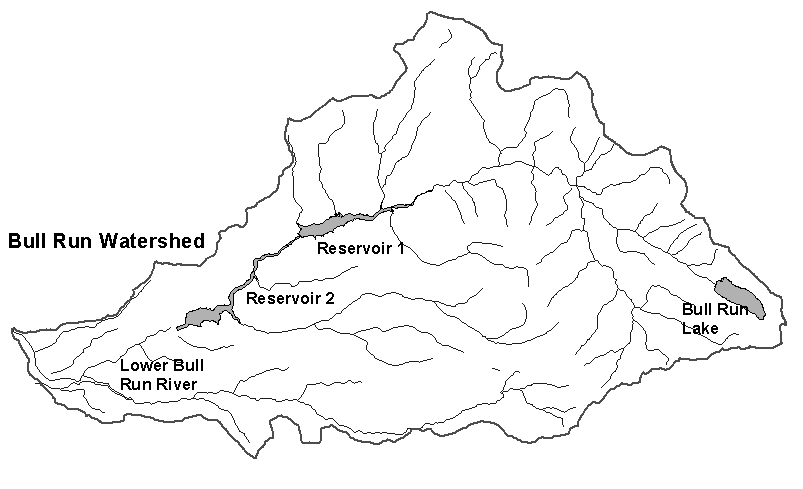
Figure 3.
Bull Run Watershed System
Starting in the late summer of 1997, the Water Bureau began monitoring the water temperature in the Lower Bull Run River using thermopod instruments stationed at various locations along the river, Figure 4. The instruments are used for monitoring the water temperature during the summer since this is the time period of most concern for providing cooler water temperatures for salmonid fish. In addition to 1997, the instruments were deployed in the summers of 1998 and 1999.
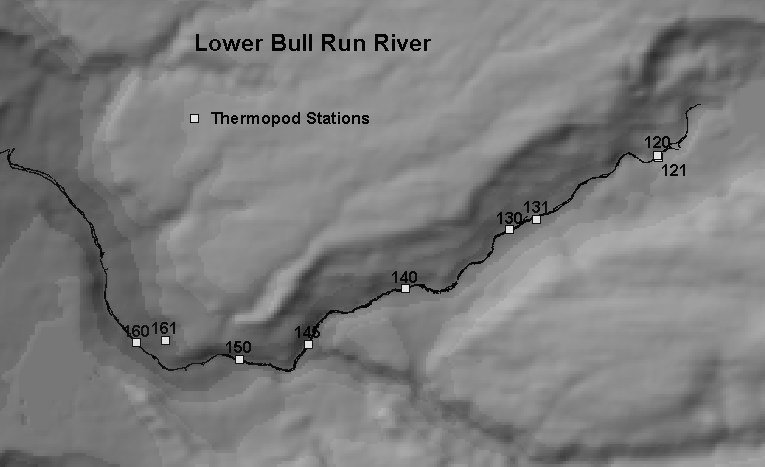
Figure 4.
Thermopod Locations in the Lower Bull Run River
The thermopod instruments were only placed in the Lower Bull Run River in 1997 in a few locations for the month of September only. Although this provided a limited data set for the summer of 1997 it nonetheless revealed that there was an increase in stream temperature moving downstream from the Plunge Pool to the County Bridge in the early part of September, Figure 5. In the later part of September the temperature increase seems to have disappeared due to a rainfall event and remained cooler after the event. Figure 12 also reveals there is a strong diurnal pattern in the water temperatures in the lower river indicating solar radiation has considerable influence on stream temperatures.
|
Station Name |
River Mile |
Location |
|
S2P |
6.6 |
Main Stem Lower Bull Run River - Below Headworks and Above Plunge Pool |
|
120 |
6.0 |
Main Stem Lower Bull Run River - 177 m downstream (below) of Res. 2 Plunge Pool |
|
121 |
6.0 |
Spillway Creek - Tributary of Lower Bull Run River at confluence |
|
122 |
6.1 |
Pool Below Plunge Pool |
|
130 |
4.7 |
Main Stem Lower Bull Run River - at USGS Gage Station 14140000 |
|
131 |
4.9 |
Gage Creek - Tributary of Lower Bull Run River at confluence |
|
140 |
3.7 |
Main Stem Lower Bull Run River - at Larson's Bridge |
|
141 |
3.8 |
Pool at Larson's Bridge |
|
145 |
3.0 |
Main Stem Lower Bull Run River - above Little Sandy River confluence |
|
146 |
3.0 |
Mouth of the Little Sandy River |
|
148 |
3.1 |
Pool Above Little Sandy Confluence |
|
149 |
3.0 |
Pool Below Little Sandy Confluence |
|
150 |
2.4 |
Main Stem Lower Bull Run River - at Bowman's Bridge |
|
160 |
1.7 |
Main Stem Lower Bull Run River - Upstream from County Bridge, above confluence with Laughing Water Creek |
|
161 |
1.9 |
Laughing Water Creek - Tributary 0.2 mi. above Confluence with the Lower Bull Run River downstream of culvert at Rd 10 |
Table 1.
Thermopod Stations and Locations
Figure 5. Water Temperature in the Lower Bull Run River, September 1997
Two dye studies were performed on the Lower Bull Run River in the summer of 1999. The first was on June 16, the second on August 5. The intention of these studies was to determine the travel times and dispersion coefficients for various stretches of the river at different flow rates.
Bull Run River Dye Study June 16, 1999
Two liters of a Rhodamine WT 20% dye solution (500 grams) was released into the river just below (200 ft) the diversion pool of Bull Run Reservoir #2 at 9:21 a.m. Water samples were taken from four downstream sites. These sites and the point of injection are shown in Figure 6. Table 2 shows the names of these sample stations and their distance downstream of the dye injection point.
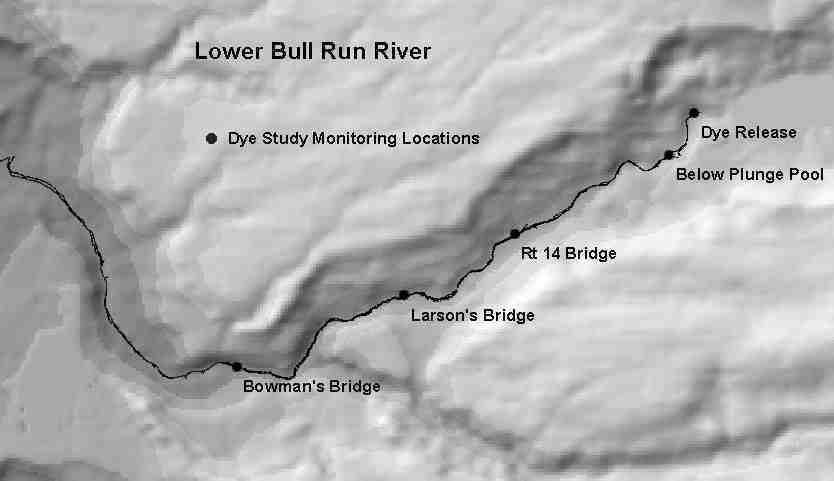
Figure 6.
Dye Study Monitoring Locations, June 16, 1999
|
Sample Site |
Code |
Distance Downstream m (ft.) |
|
Dye Injection Point |
INJ |
0 (0) |
|
Below Plunge Pool |
SPP |
579.4 (1901) |
|
Route 14 Bridge |
USGS |
2639.4 (8660) |
|
Larson’s Bridge |
LARB |
4232.6 (13,887) |
|
Bowman’s Bridge |
BOWB |
6501.8 (21,332) |
River discharge measurements were taken every 15 minutes at USGS gauge station #14140000 located just downstream of the Route 14 Bridge throughout the duration of the test. The measured flow ranged between 112 and 100 cfs (3.171 and 2.831 m3/s) with an average flow of 103.7 cfs (2.936 m3/s).
Each water sample consisted of two 25 ml glass vials filled with river water. The samples were then analyzed at Bureau of Waterworks Water Quality Laboratory. The concentration of dye was determined using a Turner Fluorometer Model #112. The minimum detection limit for these water samples was 1.0 mg/L. Continuous Fluorometer readings were also taken in the field at the USGS station. The results of the analysis are in Appendix A. A graphical display of the observed concentration data is found in Figure 7. Concentration measurements noted in Figure 7 for station SPP were taken from the left side of the river facing downstream.
Figure 7.
Dye Study Field Data
Bull Run River Dye
Study August 5, 1999
A second dye study was conducted on the Bull Run River on August 5, 1999. Rhodamine WT 20% dye solution was released at four different locations on the river and samples were taken downstream. The sample sites and points of injection are shown in Figure 8. Table 3 shows the locations, times, and mass of dye in each of the releases.
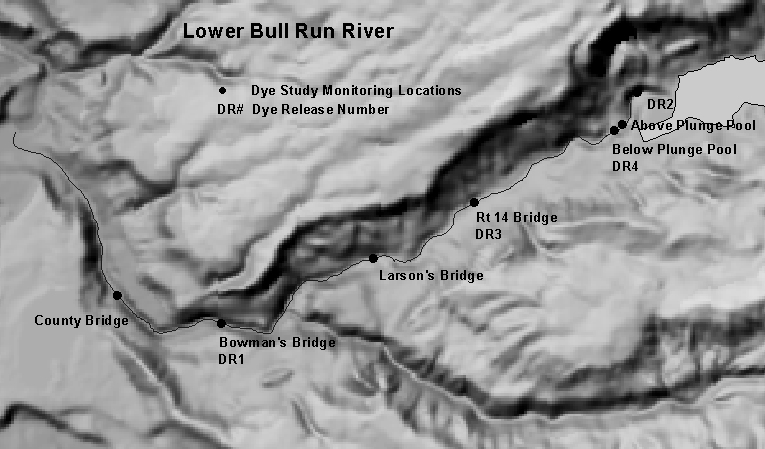
Figure 8.
Dye Releases and Monitoring Locations August 5, 1999
|
Location |
Time |
Volume 20% Dye Solution |
Dye Mass |
|
Bowman’s Bridge |
8:36 am |
200 ml |
40 g |
|
Between Diversion and Beaver Pool |
11:12 am |
500 ml |
100 g |
|
100 ft. downstream of USGS gauge |
11:45 am |
500 ml |
100 g |
|
100 ft. downstream of spillway crest |
12:15 pm |
170 ml |
34 g |
River discharge measurements were taken every 15 minutes at USGS gauge station #14140000 located just downstream of the Route 14 Bridge throughout the duration of the test. The measured flow on August 5 ranged between 11.74 and 208.3 cfs (0.3324 and 5.898 m3/s) and is shown in Figure 9. These gauge readings were used to estimate the flow at other locations on the river.
Figure 9.
Measured flow at USGS Station August 5, 1999
Each water sample consisted of a 25 ml glass vial filled with river water. The samples were then analyzed at Bureau of Waterworks Water Quality Laboratory. The concentration of dye was determined using a Turner Fluorometer Model #112. The minimum detection limit for these water samples was 1.0 mg/L. Continuous Fluorometer readings were also taken in the field at the USGS station. The results of the analysis and the field Fluorometer readings are in Appendix B.
The USGS gauge (which is 2.4 miles (3862 m) upstream from Bowman’s Bridge) recorded flows between 206 and 211 cfs (5.83 and 5.97 m3/s) from 4:30 am to 7:00 am. It was assumed that tributaries between USGS and Bowman’s Bridge increase the flow. Therefore an estimated flow of 225 cfs (6.37 m3/s) was used in all calculations for Dye Release 1.
Samples were taken approximately 200 feet (60 m) upstream of the Bull Run Powerhouse at the County Bridge (COUB) site. This resulted in a distance of 1404 meters (4607 feet) between the release and sample locations. Figure 10 shows the sample concentrations, and the time after the dye was released.
Figure 10. Field Data for Dye Release 1
At the time of dye release the recorded flow at the USGS site was 18.92 cfs (0.5358 m3/s). Throughout the day, the flow at USGS slowly decreased to 14.51 cfs (0.4109 m3/s). This flow is used in the calculations for the second dye release because the USGS is so far downstream of the point of release.
Samples were taken at two points downstream: above the spillway pool (ASP) and below the spillway pool (SPP). The ASP site was 322 m (1060 feet) and the SPP site 885 m (2900 feet) downstream of the injection point. Figure 11 shows the sample concentrations for each site, and the time after the release of dye. Sampling at ASP captured most of the plume, but sampling stopped at SPP before the plume was captured. At SPP the plume is very dispersed at the peak suggesting that the plunge pool is acting like a stirred reactor rather than a plug flow with dispersion reactor. The maximum recorded concentration was 6.7 mg/L. However, samples that were within 90% of this value were taken over a period of 70 minutes.
Figure 11.
Field Data for Dye Release 2
The dye was released at the USGS station at the same time that a flow reading was taken at USGS (18.92 cfs, (0.5358 m3/s)). Samples were taken at Larson’s Bridge, 1563 m (5128 feet) downstream. Figure 12 shows the sample concentrations and the time from release. This shows that most of the plume was captured by the sampling.
Figure 12.
Field Data for Dye Release 3
Samples were also taken at Bowman’s Bridge for this dye release. However, the laboratory analysis of the samples indicated that each sample had concentrations less than 1 mg/L.
Samples for the fourth dye release were taken at the USGS station. In total, 56 samples were taken. However, only the final 11 samples contained concentrations over 1.0 mg/L of dye. The recorded flow during the time interval when sample concentrations were at least 1.0 mg/L was constant at 15.53 cfs (0.4398 m3/s) , and the distance between the release and sampling was 1724 meters (5656 feet). Sample concentrations and time from release are shown in Figure 13. It is clear that the peak of the dye plume was not captured by the samples.
Figure 13.
Field Data for Dye Release 4
The Bull Run River, as shown below in Figure 14 and Figure 15, is a very steep stream with an average slope over 1%.
Figure 14.
Bull Run River below Reservoir #2.
Figure 15.
Longitudinal profile of the Lower Bull Run River water surface and river bottom
Appendix A Dye
Study Analysis Results (June 16, 1999)
Plunge Pool Sampling Station
|
Time after Dye Release (Minutes) |
Dye Concentration (mg/L) |
Field Comments |
|
1 |
<1 |
Rt. side looking downstream |
|
6 |
<1 |
Left side |
|
11 |
<1 |
rt. side |
|
16 |
<1 |
lt. side |
|
21 |
<1 |
rt. side |
|
26 |
<1 |
lt. side |
|
31 |
<1 |
rt. side |
|
36 |
<1 |
lt. side |
|
41 |
<1 |
rt. side |
|
46 |
<1 |
lt. side |
|
51 |
<1 |
rt. side |
|
56 |
<1 |
lt. side |
|
58.5 |
12.8 |
lt. side plume visible on left |
|
61 |
12.3 |
lt. side |
|
63.5 |
38 |
lt. layer appears to be at |
|
66 |
31.8 |
bottom 6" to 1' below surface |
|
68.5 |
39.6 |
|
|
71 |
61.4 |
|
|
73.5 |
56.7 |
|
|
76 |
49.9 |
|
|
78.5 |
49.5 |
|
|
81 |
44.7 |
|
|
83.5 |
42.6 |
|
|
86 |
36.5 |
|
|
88.5 |
33.6 |
|
|
91 |
31 |
|
|
96 |
18.6 |
|
|
101 |
22 |
|
|
111 |
9.4 |
|
|
121 |
6.6 |
|
|
131 |
4.2 |
plume still visible in
pool and downstream; no visible dye upstream of pool |
|
141 |
3.3 |
|
|
151 |
1.4 |
Route 14 Sampling Station
|
Time after Dye Release (Minutes) |
Dye Concentration (mg/L) |
|
Time after Dye Release (Minutes) |
Dye Concentration (mg/L) |
|
Time after Dye Release (Minutes) |
Dye Concentration (mg/L) |
|
0 |
<1 |
|
115 |
<1 |
|
230 |
17.6 |
|
15 |
<1 |
|
135 |
<1 |
|
235 |
15.4 |
|
30 |
<1 |
|
155 |
<1 |
|
240 |
16.7 |
|
40 |
<1 |
|
165 |
<1 |
|
245 |
14.4 |
|
45 |
<1 |
|
170 |
<1 |
|
250 |
13 |
|
50 |
<1 |
|
175 |
1.2 |
|
255 |
11.6 |
|
55 |
<1 |
|
180 |
3.4 |
|
260 |
10.3 |
|
60 |
<1 |
|
185 |
6.1 |
|
265 |
8.3 |
|
65 |
<1 |
|
190 |
8.2 |
|
270 |
6.7 |
|
70 |
<1 |
|
195 |
10.8 |
|
280 |
5.1 |
|
75 |
<1 |
|
200 |
13 |
|
290 |
3.8 |
|
80 |
<1 |
|
205 |
16 |
|
300 |
3.3 |
|
85 |
<1 |
|
210 |
18 |
|
310 |
2.5 |
|
90 |
<1 |
|
215 |
19 |
|
320 |
2 |
|
95 |
<1 |
|
220 |
19.5 |
|
325 |
2 |
|
105 |
<1 |
|
225 |
18.1 |
|
|
|
Larson’s Bridge Sampling Station
|
Time after Dye Release (Minutes) |
Dye Concentration (mg/L) |
Field Comments (wind) |
|
6 |
<1 |
calm |
|
45 |
<1 |
calm |
|
60 |
<1 |
calm |
|
75 |
<1 |
|
|
90 |
<1 |
|
|
100 |
<1 |
|
|
105 |
<1 |
|
|
110 |
<1 |
|
|
115 |
<1 |
|
|
120 |
<1 |
calm |
|
125 |
<1 |
|
|
130 |
<1 |
|
|
135 |
<1 |
|
|
140 |
<1 |
|
|
145 |
<1 |
|
|
150 |
<1 |
|
|
180 |
<1 |
calm |
|
200 |
<1 |
|
|
210 |
<1 |
|
|
220 |
<1 |
1.9 mph calibrated = 1.2mph indicated |
|
230 |
<1 |
(4 60 sec avg. 2 meters above water surface) |
|
240 |
<1 |
|
|
250 |
<1 |
1.7 mph indicated = 2.6 mph calibrated |
|
255 |
<1 |
|
|
260 |
1.2 |
|
|
265 |
2.2 |
|
|
270 |
3.7 |
|
|
280 |
7 |
1.5 mph indicated |
|
290 |
10.2 |
|
|
300 |
13.3 |
|
|
310 |
14.5 |
1.8 mph indicated |
|
320 |
14.7 |
|
|
330 |
14 |
|
|
340 |
12.4 |
0.0 mph indicated |
|
350 |
10.4 |
|
|
360 |
8.8 |
|
|
370 |
7 |
|
|
380 |
5.7 |
0.6 mph indicated |
|
390 |
4.3 |
|
|
400 |
3.7 |
|
|
410 |
2.9 |
|
|
420 |
2.3 |
|
|
430 |
2.2 |
|
Bowman’s Bridge Sampling Station
|
Time after Dye Release (Minutes) |
Dye Concentration (mg/L) |
|
Time after Dye Release (Minutes) |
Dye Concentration (mg/L) |
|
39 |
<1 |
|
395 |
<1 |
|
60 |
<1 |
|
405 |
<1 |
|
90 |
<1 |
|
415 |
<1 |
|
105 |
<1 |
|
425 |
<1 |
|
115 |
<1 |
|
435 |
<1 |
|
125 |
<1 |
|
445 |
1.4 |
|
135 |
<1 |
|
455 |
2.2 |
|
145 |
<1 |
|
460 |
2.8 |
|
150 |
<1 |
|
465 |
3.7 |
|
155 |
<1 |
|
470 |
4.8 |
|
185 |
<1 |
|
475 |
5.3 |
|
215 |
<1 |
|
480 |
6.6 |
|
245 |
<1 |
|
485 |
6.8 |
|
275 |
<1 |
|
490 |
7.8 |
|
285 |
<1 |
|
495 |
8.6 |
|
295 |
<1 |
|
500 |
9 |
|
305 |
<1 |
|
505 |
9.4 |
|
315 |
<1 |
|
510 |
9.9 |
|
325 |
<1 |
|
515 |
10.4 |
|
335 |
<1 |
|
520 |
10.5 |
|
345 |
<1 |
|
530 |
10.3 |
|
355 |
<1 |
|
540 |
10.2 |
|
365 |
<1 |
|
550 |
9.1 |
|
375 |
<1 |
|
560 |
8.5 |
|
385 |
<1 |
|
|
|
Appendix B Dye
Study Analysis Results (August 5, 1999)
Above Plunge Pool Sampling Station
|
Time after Dye Release (Minutes) |
Dye Concentration (mg/L) |
|
Time after Dye Release (Minutes) |
Dye Concentration (mg/L) |
|
10 |
<1 |
|
48 |
61.8 |
|
14 |
<1 |
|
50 |
71.9 |
|
18 |
<1 |
|
52 |
82.3 |
|
22 |
<1 |
|
57 |
85.5 |
|
26 |
<1 |
|
62 |
83.6 |
|
30 |
<1 |
|
72 |
68.2 |
|
34 |
<1 |
|
82 |
55.4 |
|
36 |
1.1 |
|
92 |
48.3 |
|
38 |
3.4 |
|
102 |
38.2 |
|
40 |
8.6 |
|
112 |
27.7 |
|
42 |
20.5 |
|
122 |
20.1 |
|
44 |
30.6 |
|
132 |
17.1 |
|
46 |
43.9 |
|
|
|
Below Plunge Pool Sampling Station
|
Time after Dye Release (Minutes) |
Dye Concentration (mg/L) |
|
Time after Dye Release (Minutes) |
Dye Concentration (mg/L) |
|
128 |
<1 |
|
238 |
2.8 |
|
138 |
<1 |
|
248 |
3.9 |
|
148 |
<1 |
|
258 |
4.8 |
|
158 |
<1 |
|
268 |
5.4 |
|
168 |
<1 |
|
278 |
6.2 |
|
178 |
<1 |
|
288 |
6.4 |
|
188 |
<1 |
|
298 |
6.4 |
|
198 |
<1 |
|
308 |
6.7 |
|
208 |
<1 |
|
318 |
6.4 |
|
218 |
1.0 |
|
328 |
6.7 |
|
228 |
1.7 |
|
338 |
6.6 |
|
|
|
|
348 |
6.4 |
Route 14 Bridge
Sampling Station
|
Time after Dye Release (Minutes) |
Dye Concentration (mg/L) |
|
Time after Dye Release (Minutes) |
Dye Concentration (mg/L) |
|
60 |
<1 |
|
225 |
* |
|
70 |
<1 |
|
230 |
* |
|
80 |
<1 |
|
235 |
* |
|
90 |
<1 |
|
240 |
* |
|
100 |
<1 |
|
245 |
* |
|
110 |
<1 |
|
250 |
* |
|
115 |
<1 |
|
255 |
* |
|
120 |
<1 |
|
260 |
* |
|
125 |
<1 |
|
265 |
* |
|
130 |
<1 |
|
270 |
* |
|
135 |
<1 |
|
275 |
* |
|
140 |
<1 |
|
280 |
* |
|
145 |
<1 |
|
285 |
* |
|
150 |
<1 |
|
290 |
* |
|
155 |
<1 |
|
295 |
* |
|
160 |
<1 |
|
300 |
* |
|
165 |
<1 |
|
305 |
1 |
|
170 |
<1 |
|
310 |
1.5 |
|
175 |
<1 |
|
315 |
1.4 |
|
180 |
<1 |
|
320 |
1.7 |
|
185 |
<1 |
|
325 |
2.2 |
|
190 |
<1 |
|
330 |
2.3 |
|
195 |
<1 |
|
335 |
3.1 |
|
200 |
<1 |
|
340 |
2.9 |
|
205 |
<1 |
|
345 |
3.6 |
|
210 |
<1 |
|
350 |
3.8 |
|
215 |
<1 |
|
355 |
4.1 |
|
220 |
<1 |
|
360 |
4.6 |
Larson’s Bridge Sampling Station
|
Time after Dye Release (Minutes) |
Dye Concentration (mg/L) |
|
Time after Dye Release (Minutes) |
Dye Concentration (mg/L) |
|
110 |
<1 |
|
210 |
27.9 |
|
120 |
<1 |
|
215 |
27 |
|
130 |
<1 |
|
220 |
24.9 |
|
140 |
<1 |
|
225 |
21.7 |
|
150 |
<1 |
|
230 |
18.6 |
|
155 |
1.3 |
|
235 |
17.5 |
|
160 |
3.5 |
|
240 |
15.6 |
|
165 |
5.8 |
|
245 |
15.5 |
|
170 |
8.5 |
|
250 |
12.3 |
|
175 |
15.3 |
|
255 |
13.4 |
|
180 |
22.2 |
|
265 |
9.5 |
|
185 |
27.2 |
|
275 |
9.4 |
|
190 |
29 |
|
285 |
5 |
|
195 |
30.4 |
|
295 |
4.9 |
|
200 |
30.8 |
|
305 |
4 |
|
205 |
29.9 |
|
315 |
3.6 |
Bowman’s Bridge Sampling Station
|
Time after Dye Release (Minutes) |
Dye Concentration (mg/L) |
|
Time after Dye Release (Minutes) |
Dye Concentration (mg/L) |
|
465 |
<1 |
|
535 |
<1 |
|
475 |
<1 |
|
545 |
<1 |
|
485 |
<1 |
|
555 |
<1 |
|
495 |
<1 |
|
565 |
<1 |
|
505 |
<1 |
|
575 |
<1 |
|
515 |
<1 |
|
585 |
<1 |
|
525 |
<1 |
|
|
|
County Bridge Sampling Station
|
Time after Dye Release (Minutes) |
Dye Concentration (mg/L) |
|
Time after Dye Release (Minutes) |
Dye Concentration (mg/L) |
|
-6 |
<1 |
|
64 |
2.9 |
|
9 |
<1 |
|
69 |
1.7 |
|
24 |
<1 |
|
74 |
1.4 |
|
34 |
<1 |
|
79 |
<1 |
|
39 |
<1 |
|
84 |
<1 |
|
44 |
1.7 |
|
94 |
<1 |
|
49 |
3.2 |
|
104 |
<1 |
|
54 |
4.6 |
|
114 |
<1 |
|
59 |
3.7 |
|
|
|