Model Geometry
Bathymetry Data
The model grid was developed based on detailed cross sections for the Columbia River and the Willamette River provided by the USACOE (Knutson, 2000).The model grid was developed using cross sections from RM 145 (Bonneville Dam) to RM 53.8 (Beaver Army Terminal) in the Columbia River and from RM 0 to RM 24 (Oregon City Falls) in the Willamette River, as shown in Figure 63. Figure 64 shows two example cross sections in the Willamette River provided by USACOE.
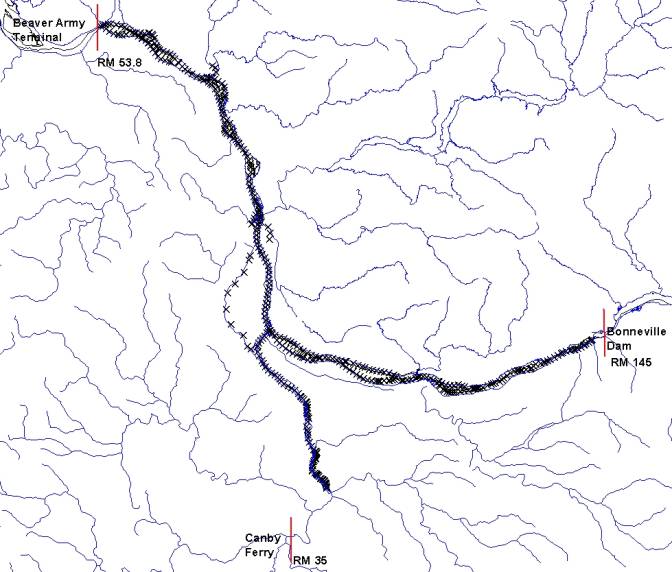
Figure63.Columbia and Willamette River cross-section locations
Bathymetry data in the Willamette River between RM 24 and just below the Oregon City Falls (RM 26.5) were obtained from a survey work done in 1999 by the USACOE using a sound transponder and Global Positioning System (GPS).The bathymetry data for the last 0.3 miles between the USACOE data set and the Oregon City Falls were obtained by digitizing bathymetric estimates on the USGS quadrangle map.The data sets provided x, y, and z coordinates that were combined and used in SURFER, a 3-D mapping program, to develop the model grid between RM 24 and the Oregon City Falls. Figure 65 shows the location of the data provided by the USACOE and the USGS map.
Cross-sections of the Willamette River between the Oregon City Falls (RM 26.8) and Canby Ferry (RM 35) were provided by Portland General Electric (PGE, 1998). The cross-sections were based on a survey done by the National Oceanic and Atmospheric Administration (NOAA) in October 25, 1997.Figure 66 shows the extent of the cross sections available for this reach of the river. Figure 67 shows a sample cross-section at RM 29.6.
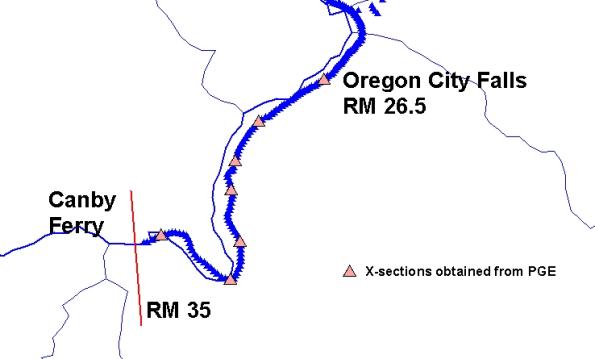
Figure66.Willamette River cross-sections locations from PGE
Bathymetry data from RM 0.0 to RM 1.2 in the Clackamas River and the cove (an abandoned gravel pit) connected to the Clackamas River was obtained from survey work conducted by Pacific Water Resources (Savage, 2000).One mile of the Clackamas River and the cove were incorporated in the model since both are tidally influenced. The head of tide in the Clackamas River ends above the entrance of the cove (Kyle, 2000).The bathymetry data were combined with elevation data from the USGS Digital Elevation Model to extract model cross-sections for CE-QUAL-W2.Figure 68 shows contour plots of the data used to generate the grid for the model.
Model Grid Development
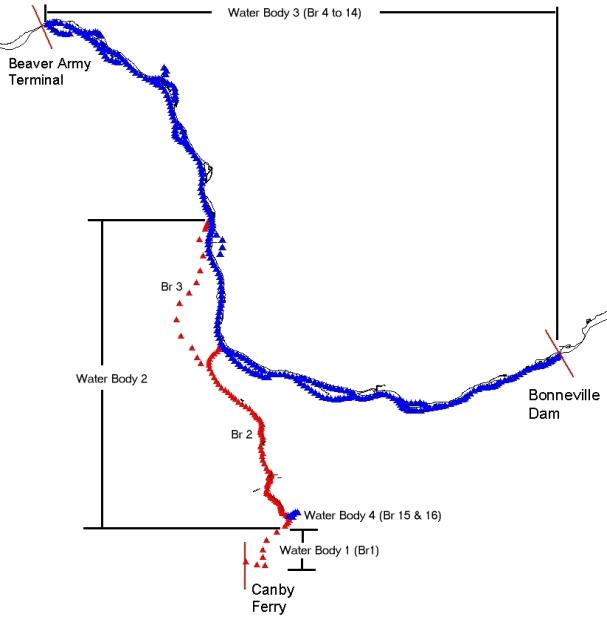
Using the river cross-sections and the bathymetric contour plots discussed above, the model grid was developed for 4 water bodies.Figure 69 shows a layout of the model grid.A total of 16 branches make up the 4 water bodies in the model.The Willamette River above the Oregon City Falls is modeled as one branch within a waterbody.The second Waterbody consists of two branches, the first is the mainstem of the Willamette River and the second is Multnomah Channel.The Columbia River represents a third waterbody with 11 branches.The first branch is the main channel of the Columbia River and the remaining 10 branches are at tributary inflows or side channels around islands in the river.The fourth waterbody represents the lowest reach of the Clackamas River and a gravel pit cove on the side.Segment size was based on the spacing of the cross-sections in the bathymetry data.Layer thickness in the model is 2 meters throughout.Table 17 provides the model grid specifications and boundary conditions for each branch.
|
|
|
|
|
|
|
|
|
|
|
|
|
|
Canby
to Falls
|
|
|
|
|
|
|
|
|
|
|
Falls
to Columbia River
|
|
|
|
|
|
|
|
|
|
|
Multnomah
Channel
|
|
|
|
|
|
|
|
|
|
|
Columbia
River, Bonneville to Beaver Terminal
|
|
|
|
|
|
|
|
|
|
|
Reed
Island Channel
|
|
|
|
|
|
|
|
|
|
|
Government
Island
|
|
|
|
|
|
|
|
|
|
|
Oregon
Slough
|
|
|
|
|
|
|
|
|
|
|
Bachelor
Island
|
|
|
|
|
|
|
|
|
|
|
Sandy
Island
|
|
|
|
|
|
|
|
|
|
|
Carrols
Channel
|
|
|
|
|
|
|
|
|
|
|
Cowlitz
River
|
|
|
|
|
|
|
|
|
|
|
Lord
Island
|
|
|
|
|
|
|
|
|
|
|
Fisher
Island
|
|
|
|
|
|
|
|
|
|
|
Bradbury
Slough
|
|
|
|
|
|
|
|
|
|
|
Clackamas
River
|
|
|
|
|
|
|
|
|
|
|
Clackamas
River Gravel Pit
|
|
|
|
|
|
|
|