Proposal
Modeling the Bull Run River-Reservoir
System
by
Scott A. Wells
Professor of Civil Engineering
Portland State University
Portland, OR 97207-0751
Prepared for
Portland Water Bureau
City of Portland
October 19, 1998
Introduction
The City of Portland, Water Bureau currently operates 2 Bull Run reservoirs,
Reservoir #2 and Reservoir #1 as a water supply source in the Bull Run
watershed shown in Figure 1 and Figure 2. The Water Bureau wants to operate
their water supply system in order to meet both water supply objectives
and fish habitat objectives downstream of the Bull Run reservoirs in Bull
Run River. In addition, a third Bull Run reservoir has been proposed as
an additional water supply source. This reservoir also may be used to meet
water supply and fish habitat objectives in Bull Run River.
This proposal addresses performing the following tasks to evaluate these
objectives:
-
Gather data to construct a computer simulation model of the Bull Run system
including Bull Run River, Bull Run Reservoirs #1 through #3 and the river
basin without reservoirs
-
Ensure that the model accurately represents the system physics, chemistry
and biology
-
Use the model to evaluate how to meet water supply and fish habitat objectives
by implementation of management scenarios
The proposal is divided into the following elements:
-
Background Studies
-
Modeling Approach
-
Detailed scope-of-work and task list
-
Project Schedule
-
Project Deliverables
-
References
Background Studies
The Bull Run system has been studied extensively by hydrologists and
scientists. Some of these prior studies include:
-
Temperature modeling in the Bull Run River below Reservoir #2 by R2 Resource
Consultants, Inc. using the SNTEMP model (R2 Resource Consultants, 1997).
The bathymetry data for Bull Run River and the shading data are important
pieces of information for further model development described in this proposal.
-
Evaluation of turbidity dynamics in the Bull Run Watershed by the USGS
(LaHusen, 1994). This study evaluated cause-effect relationships between
increases in turbidity and flows and geology in the basin. A relationship
between suspended solids and turbidity was developed.
Figure 1. Bull Run watershed in
the Portland basin.
Figure 2. Bull Run study area.
-
Analysis of water quality variations between 1978-1983 for the Bull Run
River above the Reservoirs by the USGS (Rinella, 1987). This study also
had statistical correlations of streamflow with basin area and precipitation,
but these correlations were annual averages, rather than daily. This study
should provide useful data on inflow water quality to the reservoirs and
Bull Run Lake.
-
A study of the hydrology of flows into the proposed Bull Run Reservoir
#3 by Montgomery-Watson (1994). This study developed a correlation of flow
rates at a USGS gaged location to one further up the Bull Run River that
would be the inflow into Reservoir #3. A simple water balance model was
used.
-
A thorough review of water quality in the Bull Run Reservoirs by Environmental
Chemistry, Inc. (1994). A simple well-mixed box model of the acid-base
chemistry of the system was used for the reservoirs. Statistical correlations
were performed for turbidity as a result of reservoir stage and precipitation
volume.
-
Sediment sizing on the deltas to the reservoirs and on the reservoir banks
by Chester Environmental (1994).
-
Evaluation of evidence of algal diatoms in the sediments (Sweet, 1992).
There did not appear to be evidence of any green or bluegreen algae.
-
A study on the hydrology of Bull Run Lake by the USGS containing useful
information on inflows and outflows from the Lake (Snyder and Brownell,
1996)
-
PSU studies of sediment deposition in the Bull Run watershed (Petersen,
Hamilton, and Burns, 1995). This study performed sediment size distributions
and sediment accumulation rates in Reservoir #1.
These studies will provide valuable information for estimating boundary
conditions for the development of the Bull Run system model. These boundary
conditions include estimating runoff into the reservoirs, sediment (turbidity),
and water quality.
Modeling Approach
In order to have a model that is a reliable predictor of temperature
and suspended solids (turbidity) in the reservoir system, a dynamic, spatially
explicit hydrodynamic and water quality model is necessary.
Other models have been developed in past studies, and these include:
-
Well-mixed box model for acid-base chemistry
Even though Environmental Chemistry (1994) recommended using a water quality
and hydrodynamic model of the watershed, they did not have the resources
allocated to pursue that task. The model used for their work was a well-mixed
box, acid-base chemistry model.
-
Well-mixed box model for volume conservation (Montgomery-Watson, 1994)
-
SNTEMP model (R2 Resources, 1997) for the Bull Run River
The SNTEMP model was originally developed in 1984 and was based on predicting
daily average stream temperatures using daily average meteorological data,
stream morphology, and information on bank shading. The model uses Manning's
equation for steady-state flow and also predicts daily maximum temperatures
using a statistical regression model. This model is not able to predict
instantaneous water temperatures and is unable to model dynamic stream
flow.
For this project, the CE-QUAL-W2 River Basin Model Version 3 is proposed
as the most appropriate for modeling the Bull Run system since it contains
the following elements:
-
Two-dimensional, dynamic hydrodynamics and water quality capable of replicating
the density stratified environment of the reservoirs and the sloping river
channel sections as well
-
Suspended sediment (and from correlation, turbidity) transport and deposition
using multiple sediment sizes
-
River-reservoir linkage is transparent for the Model User; there is no
need to use one model for the river sections and another for the reservoir
-
The model can be used to simulate ambient riverine conditions without the
reservoirs in-place
-
At a future time, Bull Run Lake can be connected to the system model as
a waterbody even though it may not be directly connected to the Bull Run
River; algorithms can easily be developed for flow from the Lake to the
Bull Run River based on groundwater flow dynamics and inserted into the
system model
This model has been under development for many years and is a public-domain
code maintained by the Corps of Engineers, Waterways Experiments Station
(WES), located in Vicksburg, Mississippi. The current version, Version
2 (Cole and Buchak, 1995), has been superceded by Version 3 developed by
WES and Wells (1997). Version 3 has undergone rigorous testing (Wells,
1998) and has been successfully applied to the Lower Snake River system
(Wells and Berger, 1998). This version has the ability to model the following
parameters: dissolved and particulate non-living organic matter (both refractory
and labile components), ammonia, nitrate, dissolved PO4, 3 algal
types, TDS, inorganic suspended solids, tracer, pH, total inorganic carbon,
alkalinity, the carbonate species, and bacteria.
Conceptually, the model elements, shown in Figure 3, are
-
Bull Run River below Reservoir #2
-
Reservoir #2
-
Reservoir #1
-
Bull Run River above Reservoir #1
-
Reservoir #3
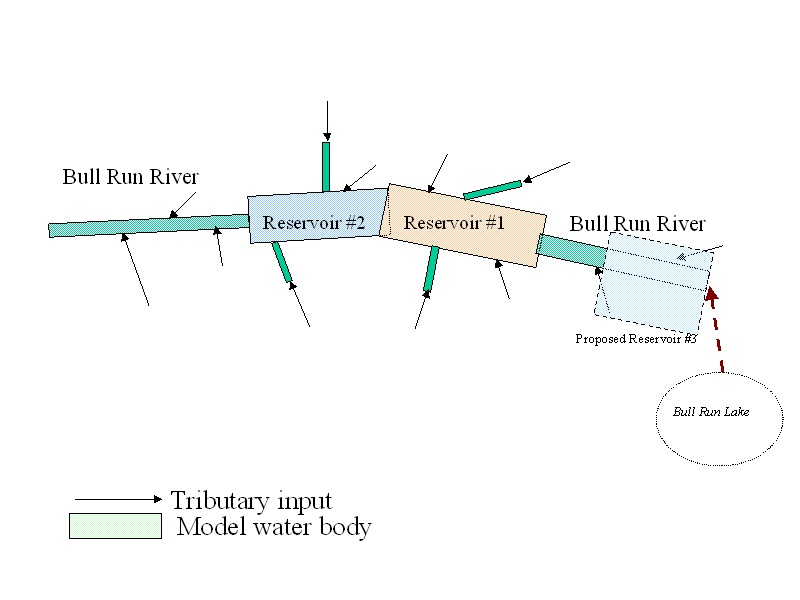 Figure 3. Conceptual layout of the Bull Run system.
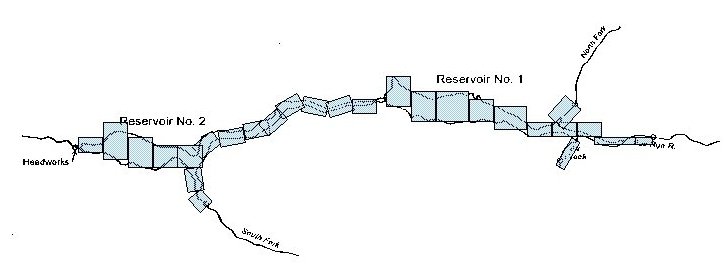
Figure 4. Preliminary conceptual layout of model segements for
Bull Run Reservoir #2 and Reservoir #1.
Other tributary or branches may be added to the main system elements.
Each of these elements will be broken into model branches (sets of segments)
and segments (composed of vertical layers), as shown conceptually in Figures
4 and 5 for the Reservoirs and Bull Run River. A profile of the system
model is shown in Figure 6. Computer animations for water temperature and
turbidity will be developed based on this type of profile. A typical river
or reservoir cross-section is broken down into several model layers as
shown in Figure 7.
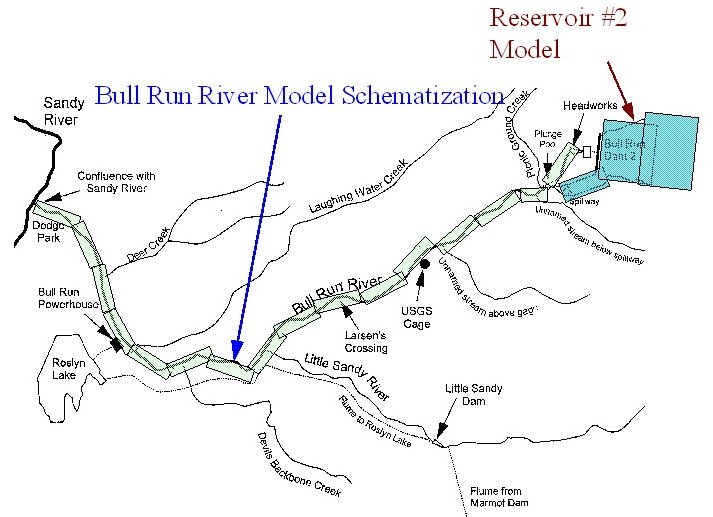
Figure 5. Preliminary conceptual layout of model segements for
Bull Run River and part of Bull Run Reservoir #2.
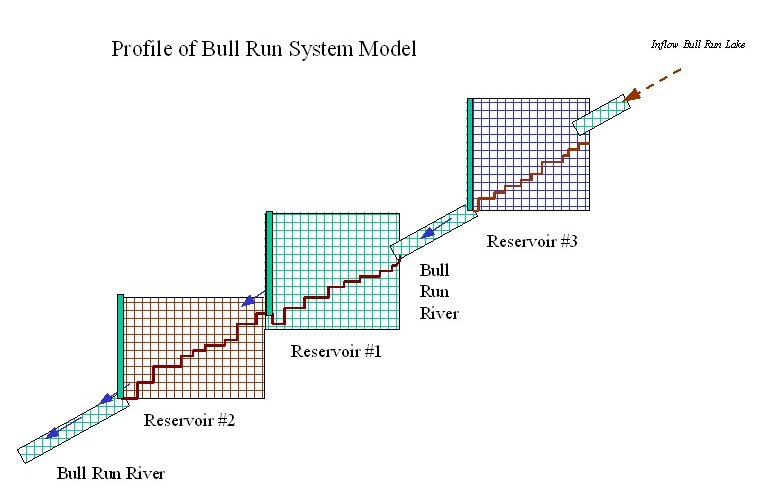
Figure 6. Profile of Bull Run system model with Reservoir 3.
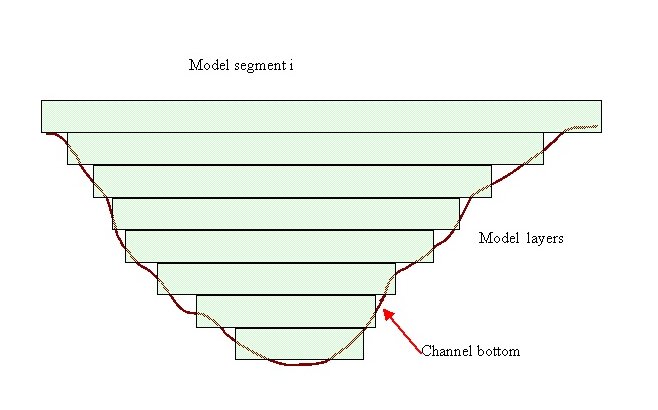
Figure 7. Channel layer schematization.
The model will be set up for calibration of turbidity, temperature,
and dissolved oxygen data in the reservoirs and in the streams under existing
conditions. Also, the model will be set-up to evaluate pre-impoundment
conditions for temperature. The model will also be used to forecast the
impacts of management scenarios on temperature and water quality conditions
in the reservoirs.
Advantages of the Use of CE-QUAL-W2 over Prior
Models Developed for the Bull Run System
Prior model studies of the reservoirs by Environmental Chemistry (1994)
and Montogmery-Watson (1994) did not account for the complex circulation
and stratification in the reservoir systems. These prior models assumed
a well-mixed box for each reservoir. The CE-QUAL-W2 model was developed
for narrow, deep, long reservoir systems that exhibit density stratified
and density induced currents. The model also has selective withdrawal algorithms
for the water withdrawals.
Other one-dimensional reservoir models, such as the HEC WQRRS (Water
Quality River-Reservoir Simulation) model and the Corps's CE-QUAL-R1, are
also not adequate to compute 2-D circulation within reservoir systems.
These models conceptualize the reservoir as well mixed in each horizontal
slab, i.e., over the length and the width of the system. By making this
assumption, the vertical and longitudinal circulation patterns within a
reservoir cannot be resolved.
A prior and on-going river modeling study using SNTEMP has been performed
for the Bull Run River. The river modeling being performed using SNTEMP
is different from that proposed using CE-QUAL-W2. Some of these differences
and similarities are shown in Table 1.
Table 1. Comparison of SNTEMP and CE-QUAL-W2 models
for riverine sections.
| Model |
Hydraulics |
Meteorological data and temperature modeling |
Shading |
| SNTEMP |
Steady-state; most 1-D river models require
a friction factor that varies with stream flow or stage |
Model requires daily-average meteorological
data (even though travel time from Reservoir #2 to the Sandy River can
be less than a day) and computes daily-average temperatures; maximum temperatures
are computed using a statistical correlation |
Realistic topographic and vegetative shading
algorithm |
| CE-QUAL-W2 |
Unsteady, multi-layer model with segment-by-segment
variation of friction factors; ability to model system using one-friction
factor for the entire range of flows |
Model computes instantaneous solar radiation
and will use 3-hourly updates for air temperature, dew-point temperature,
wind speed/direction and cloud cover, model computes in-stream instantaneous
temperatures |
Realistic topographic and vegetative shading
algorithm |
The ability to model instantaneous temperatures as proposed using the
CE-QUAL-W2 model is also critical to being able to evaluate model sensitivities
and errors. Using the daily-averaged approach for the Bull Run River, as
in the SNTEMP application, masks model errors and does not allow the modeler
to understand model errors and weaknesses. In a river of such short travel
time (a day or less), the Bull Run River below Reservoir #2 requires a
model capable of predicting instantaneous temperatures.
Other 1-D river models could also be applied to the Bull Run River,
such as Corps' CE-QUAl-RIV1 and the EPA's DYNHYD/WASP models. The CE-QUAL-W2
model though allows for deep pools in the river sections and allows for
true 2-D river open channel flow. The advantages of CE-QUAL-W2 Version
3 to other river models were illustrated in Wells (1998). One primary advantage
of CE-QUAL-W2 was that the friction factor did not need to be varied as
the river stage increased.
Overall, the CE-QUAL-W2 model not only has a solid theoretical basis
for modeling the Bull Run system, it also has state-of-the-art numerical
schemes that minimize numerical stability and accuracy issues evident in
older models. The new version 3 of CE-QUAL-W2 uses the Quickest-Ultimate
Scheme for translating or advecting sharp fronts.
Scope-of-Work
In order to accomplish the objectives noted in the Introduction, the
following list of tasks and sub-tasks will be necessary to be accomplished:
-
Background Data Analysis
-
Data Acquisition from Water Bureau: Historical and current data for the
Bull Run system will be obtained and organized at PSU into an ACCESS database
for ease of retrieval and storage. Data necessary from the Water Bureau
include:
-
Bathymetry data for Bull Run River (using data from the SNTEMP model),
Reservoir #1, Reservoir #2, and the proposed Reservoir #3, as well as topographic
information for drainage basins surrounding the Bull Run watershed.
-
Meteorological data from the Bull Run watershed and from the PDX airport
-
Temperature and water quality data from Bull Run streams and reservoirs.
This includes water quality and temperature profiles from the reservoirs,
water quality and temperature data from Bull Run River and from Bull Run
Lake.
-
Suspended solids and turbidity data from the reservoirs and inflow streams.
Particle size distributions, specific gravity, and correlations between
turbidity and suspended solids from prior studies will also be used.
-
Flow rate data. This includes flow rates passed through each reservoir
and in-stream measurements of flow. Hydrological analyses performed on
drainage basins from earlier studies will also be used to estimate streamflow.
-
Water surface elevation data from Bull Run Reservoirs #1 and #2, as well
as from Bull Run Lake
-
Analysis of Background Data
-
Bathymetry data. These data will be imported into a 3-D terrain-mapping
program in order to generate the bathymetry of the model and to compare
with current estimates of theVolume-Area-Elevation for each reservoir.
These data will also be used with the temperature profile data to estimate,
prior to modeling, the volume of cold water available to be used for meeting
fish habitat objectives in Bull Run River.
-
Meteorological data. If little data are available from the Bull Run system,
an attempt will be made to correlate Bull Run meteorological data with
NOAA Portland International Airport (PDX) data and/or use theoretically
based corrections to air and dew-point temperature based on elevation differences
between the Bull Run watershed and the PDX airport.
-
In-stream temperature, water surface and water quality data. These data
will be used for calibration of the Bull Run system model. Also, PSU will
provide animations of in-stream data if there is a sufficiently high-resolution
(in time and space) data set for evaluation.
-
Flow rate data. These data will be used as boundary conditions for the
model.
-
Generation of Boundary Conditions for flow, temperature and water quality
for the Bull Run watershed. The Bull Run system receives inflows from rainfall,
runoff, and snowmelt. In order to model the reservoir system, an accurate
accounting of the flows and quality/temperature of those flows are necessary.
There are several approaches to this problem. One approach is to model
each drainage basin using the EPA models HSPF or SWMM and predict the temperature
and quality from each basin. This approach is too time-consuming to be
used during this initial study since it also would require additional field
studies. Alternatively, the net inflow to each reservoir can be determined
using the water surface elevation data, known outflows and reservoir bathymetry.
Then the computed inflows would be disaggregated to each major inflow stream
based on its drainage basin area. The filtered equilibrium temperature
based on meteorological conditions would be computed to estimate inflow
temperatures using techniques developed in Adams and Wells (1984). Other
aspects of the water quality, including sediment and turbidity, are more
difficult to estimate and would need to be based either entirely on data
correlations or on theory with data for calibration and verification. Prior
hydrological studies of the basin will also be used extensively. In general,
measuring stations for flow and quality will be used as upstream boundary
conditions for the system model. These include stations located at South
Fork in Reservoir #2 and at North Fork in Reservoir #1. The Bull Run River
gage above Reservoir #1 will be used for initial calibration of the reservoir
models and will be initially used for the upstream boundary for Reservoir
#1. But this boundary will change once the upper section of the Bull Run
River is modeled. At that point the Bull Run River gage above Reservoir
#1 will be used as a calibration location for the model.
-
System Model Set-Up. The CE-QUAL-W2 river basin model Version 3 will be
used for the Bull Run system since it is uniquely able to model the entire
system with a state-of-the-art hydrodynamic and water quality model. This
model application will initially involve modeling temperature, suspended
solids, water surface elevations, and vertical and horizontal velocities.
The suspended solids will be broken down into several size fractions. Work
performed by Petersen et al. (1995) analyzed 5 sand size fractions, 3 silt,
and 3 clay fractions. Initial model work will also use these 11 size fractions
for suspended solids. Turbidity will also be predicted based on data correlations
with suspended solids. The model incorporates the effect of suspended solids
on light penetration and density induced currents.
-
System Model Schematization. Layout the model domain and grid for the river
and reservoir/lake model branches. Evaluate grid resolution issues.
-
Determine Model Calibration Time Period. Determine the model calibration
period based on available data.
-
Preparation of Model Input Files. Prepare model input files for inflows
(flow rates, temperature, and water quality), outflows, meteorological
conditions, and bathymetry
-
Model Alterations. The existing model needs to be adapted to the specific
needs of the Bull Run system. This includes adding the following algorithms
to the CE-QUAL-W2 Version 3 code: shading algorithm that was originally
developed for the Columbia Slough model, additional suspended solids particle
size fractions (the current code has one sediment size fraction). With
the addition of Bull Run Lake to the system model, a groundwater flow algorithm
may be necessary to link the Lake to the Bull Run River.
-
Identification of Additional Field Sampling. More refined field data may
be necessary to set up the model. These data will be identified based on
a model sensitivity analysis.
-
Model Calibration/Verification. Compare model predictions of temperature,
suspended solids (turbidity), dissolved oxygen, and water surface elevation
to field data. Other parameters also may be compared. Adjustment of model
parameters so that model predictions agree reasonably with field data.
A formal sensitivity analysis will be performed and documented. Development
of computer graphics/animations to explain Bull Run system dynamics.
-
Evaluation of Management Strategies for Water Supply and Fish Habitat Objectives
-
Determination of Management Scenarios. In conjunction with the Water Bureau
and its consultants, determine a list of management scenarios to evaluate
using the model.
-
Implementation of Management Scenarios with the System Model. The model
will be used to evaluate each management scenario and provide statistical,
graphical and computer animation evaluations.
-
Development of the Bull Run River system without reservoirs. The Bull Run
system will be modeled without Reservoir #1 and Reservoir #2. Simulations
will be made evaluating the natural ambient temperature regime.
-
Model Training for Water Bureau Staff. PSU will provide a succinct User's
Manual for the model and provide training for staff at the Water Bureau
on running the model and using the model to evaluate additional management
scenarios.
-
Analysis of Summer 1999 Field Data. The summer of 1999 field data will
be put into the ACCESS database developed earlier. The data will be visualized
and evaluated. Also, the model will be used to verify field data for 1999.
This will ensure reliability of the Bull Run system model.
-
Project Management. Attend meetings with the Water Bureau, its consultants,
regulators, and citizen groups explaining the modeling process and the
results, manage PSU staff, report/memo writing
-
Possible Additional Topics. These topics are not explicitly included in
the scope-of-work since many of the issues related to this would need to
be explored after many of the work tasks are completed.
-
Sediment Transport Modeling. The above model will be able to transport
suspended solids and deposit it, but it does not have a feedback with the
geometry of the system to change the bathymetry nor to scour it during
periods of high shear stress. In this case, a predictive sediment scour
model would be developed based on field data of particle size distribution
and other laboratory tests. PSU has the laboratory facilities to measure
the physical properties of solids: a HIAC particle size analyzer, electronically
controlled settling column for particle settling velocity determination,
oven/muffle furnaces, analytical balances.
-
Watershed Model Development. Use a hydrologic model, such as SWMM or HSPF,
and tie it into the Bull Run system model for prediction of runoff. Develop
a field study plan for data necessary to calibrate a watershed model.
-
Graphical User Interface Development. Develop a GUI interface so that Water
Bureau staff can easily use the model. This interface would use Visual
Basic. The interface can be designed for use by someone trained, or for
someone with little or no training, such as for the general public.
-
An additional algorithm that may be necessary is the inclusion of a more
complex sediment-heat flux algorithm. The current CE-QUAL-W2 model does
not account for solar radiation being absorbed in the sediment and re-radiating
or re-diffusing heat back into the water column. The importance of this
issue will be determined by an evaluation of model sensitivities and calibration.
This may especially be important in shallow stream sections exposed to
sunlight.
-
Operational Tool Development. Use the Bull Run System model to forecast
operational strategy for the system based on meteorological data. Use the
model in a forecasting mode to meet operational objectives.
Project Schedule
The project schedule is shown on the following page and assumes a project
start of 11/1/98. PSU recognizes the importance of meeting the Water Bureau's
deadline of 9/99 for making significant management decisions regarding
Bull Run Reservoir #3 and flow and temperature releases in the Bull Run
River. A draft report on the calibration and management issues is scheduled
for the 9/99 time frame with the final report coming after public comments
and after any additional management scenarios were run. Project end date
was set as 6/30/00 in order to complete further work required by regulators,
Bureau staff, or the public as a result of the publication of the draft
report, to explore the summer 1999 data set in terms of model reliability,
and to train Water Bureau staff in the use of the model.
Project Schedule
Project Deliverables
PSU plans to deliver the following items to the Water Bureau:
-
A technical report on the background data analysis and model set-up
-
A technical report on the model calibration and model alternatives analysis
-
A technical report on the analysis of 1999 field data
-
Technical memoranda as required
-
CD containing the model code and project files
-
CD containing model animations of calibration and alternatives analyses
-
Train City of Portland Water Bureau staff on the use of the model and provide
a User's Manual
In addition, the principal investigator will be available to make presentations
or to act as a consultant for the Water Bureau during meetings with Bureau
staff, its consultants, and the public.
Personnel
The project manager will be Dr. Scott A. Wells, Professor of Civil Engineering.
Mr. Robert Annear and Mr. Chris Berger, both Ph.D. students in Civil Engineering,
will be assisting in data acquisition, model set-up, model calibration,
and management scenario development. Resumes of these individuals are attached
to this proposal. Other graduate students in Civil Engineering may be used
during the project period.
References
Adams, E. E. and Wells, S. A. (1984) "Field Measurements on Side Arms
of Lake Anna, Virginia," Journal of Hydraulic Engineering, ASCE,
Vol. 110, No. 6, 773-793.
Chester Environmental (1994) "Sediment Survey of the Bull Run Reservoir,"
prepared for the City of Portland, Tigard, OR.
Cole, T. and Buchak, E. (1995) "CE-QUAL-W2: A Two-Dimensional, Laterally
Averaged, Hydrodynamic and Water Quality Model, Version 2.0," US Army Corps
of Engineers, Instruction Report EL-95-1, Waterways Experiments Station,
Vicksburg, MS.
Environmental Chemistry (1994) "Water Quality in the Bull Run Reservoirs,"
prepared for the Portland Water Bureau, Corvallis OR
LaHasen, R. (1994) "Variations in Turbidity in Streams of the Bull Run
Watershed, Oregon 1989-1990," USGS Water-Resources Investigations Report
93-4045, Portland, OR.
Montgomery Watson (1994) "Regional Water Supply Study - Phase 2 Surface
Water Availability," Prepared for the Portland Water Bureau, Portland,
OR.
Petersen, C.; Hamilton, D.; and Burns, S. (1995) "Sediment Deposition
in Reservoir No. 1, Bull Run Watershed, Oregon," Department of Geology,
Portland State University, Portland, OR.
Rinella, F. (1987) "Water-Quality Variations in the Bull Run Watershed,
Oregon, Under 1978 to 1983 Management Conditions," USGS Water-Resources
Investigations Report 87-4128, Portland, OR.
R2 Resources (1997) "Simulation of Water Temperatures in the Bull Run
River Using the SNTEMP Temperature Model," Draft report prepared for Portland
Water Bureau, Redmond, WA.
Synder, D. and Brownell, D. (1996) "Hydrogeologic Setting and Preliminary
Estimates of Hydrologic Components for Bull Run Lake and the Bull Run Lake
Drainage Basin, Multnomah and Clackamas Counties, Oregon," USGS Water-Resources
Investigations Report 96-4064, Portland, OR.
Wells, S. A. (1997) "Theoretical Basis for the CE-QUAL-W2 River Basin
Model," Technical Report EWR-6-97, Department of Civil Engineering, Portland
State University, Portland, Oregon, 62 pages.
Wells, S. A. (1998) "Code Development and Testing of the CE-QUAL-W2
River Basin Model," Technical Report EWR-4-98, Department of Civil Engineering,
Portland State University, Portland, Oregon, 85 pages.
Wells, S. and Berger, C. (1998) "The Lower Snake River Model," prepared
for HDR Engineering, Boise, ID.