A High-Speed Metropolitan Area Network Measurement Study
PSU Computer Science, Technical Report TR-00-06, December 1, 2000.
Jim Binkley - Computer Science, Portland State University
jrb@cs.pdx.edu
Don Westlight - Information Technology, Oregon Graduate Institute
don@admin.ogi.edu
Abstract
In this paper we present a high-speed measurement study of round-trip delays, and TCP throughput with various window sizes. The measurements using ping and ttcp are performed over 155 mbit OC-3 Packet over SONET MAN connections. In addition, short hop test results over zero, 1, and 2 layer 2 switched gigabit ethernet connections are presented. In general, FreeBSD was used for host testing. A few miscellaneous host-oriented tests were also performed using Cisco IOS, Linux redhat, and Solaris.
1 Introduction
 In the summer of 1999, Oregon Graduate Institute (OGI), Oregon Health Sciences University (OHSU), and Portland State University (PSU), all located in the Portland Oregon region, received a grant from the National Science Foundation to allow the three universities to construct a Metropolitan Area Network and to join Internet2 using the Abilene backbone via the University of Washington. The network was given the name PREN [PREN], for Portland Research and Educational Network. Due to time delays in obtaining circuits, and in creating eight fiber-based long-haul SONET connections, the network finally became operational in the early summer of 2000. The three Portland area universities now have high speed Internet2 connectivity and for the first time are all directly connected to each other across Portland at 155 mbit speeds.
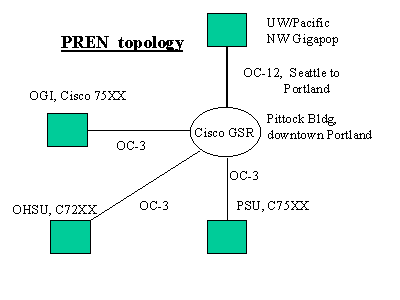
PREN consists of four links (see figure 1, PREN topology):
A central routing hub was established in a "carrier hotel" in downtown Portland at the Pittock Building (approximately 9th and Washington). A Cisco GSR 12000 router was purchased and placed there along with a certain amount of gigabit and 100BASE Cisco ethernet switches. The switches allow internal hosts for monitoring, local ethernet connections to commodity Internet vendors, and an internal gigabit ethernet connection to the U/W’s Pacific Northwest (PNW) gigapop. The connection to Abilene (http://www.ucaid.edu/abilene) consists of an OC-12 connection from a PNW presence in the Pittock building to the Westin Hotel in Seattle. The three universities in Portland connect to Pittock via OC-3 (155mbit) Packet Over Sonet connections. PSU and OGI have Cisco 7500 routers as PREN border routers. OHSU has a Cisco 7200 router. All three universities internally have backbones based on Cisco switches principally consisting of Cisco Catalyst 5500 switches with so-called routing "blades" (routers as a board in a multi-board chassis). Internally OGI and PSU have gigabit ethernet connections from main campus layer 2 switches to other campus buildings and for the most part have many smaller ethernet switches. OHSU internally uses an ATM backbone, with ethernet in the outlying regions.
As a result of the establishment of PREN, the network engineers at the three campuses decided to conduct a network measurement study. We were motivated by curiosity in terms of engineering capabilities. All the network engineers in the PREN community were interested in seeing what we could learn about our various pieces of Cisco network gear, including various Cisco routers, with a central Cisco GSR 12000 router and border routers like the Cisco 7506. We had just obtained MAN OC-3 SONET links at 155mbits. We also had ethernet-based switches including big switches like the Catalyst 5500, and smaller switches used in more peripheral parts of our networks including Cisco 3508G and 3524X switches. Our switches typically had gigabit ethernet ports, commonly used for switch to switch aggregation uplinks or switch to router connections. We were also in the process of obtaining for the first time various hosts with gigabit ethernet links.
Our test goals included:
1. measuring PREN MAN link (OC-3/Sonet) TCP speeds, campus to campus and round-trip time (RTT) delays with ping. We wanted to test window sizes with TCP, including 16k, 32k, 64k, and 128k. We measured RTT times with ping for various packet sizes including 56, 250, 500, 1024, and 1460 bytes. We wanted to see if any bottlenecks existed, and if so, figure out the cause.
2. gaining experience with test hosts that used gigabit ethernet. We did not have the knowledge to build the fastest possible host in the world. We simply wanted a commodity host that might logically serve as best of breed at a campus and that would be able to generate packets at a range 2-3x greater than our 155 mbit SONET connections. Our test hosts were purchased locally and typically cost on the order of $1k. Gigabit ethernet cards were donated to the PSU networking lab by Intel, but at the time of purchase cost on the order of $600 apiece.
3. measure switch (and sometimes router) throughput from single switches up to backbone configurations (sometimes this simply meant two gigabit ethernet switch connections back to back), and of course, more complex MAN campus to campus or campus to Pittock interconnections. The latter might have 9 Cisco infrastructure pieces between the paired test hosts.
4. As a side goal, we hoped to convince management and/or the network engineers themselves that such tests were useful and that a practice of testing infrastructure gear as a matter of IT culture might be a useful philosophy.
Consequentially, we decided to make roughly four kinds of network tests using ping and the old standard ttcp "test tcp" tool [see section 2 for more details]. Our standard test host consisted of a Intel PIII 700mhz PC, with an Intel gigabit ethernet card (WISEMAN controller) running FreeBSD 4.0 or 4.1. A pair of hosts were given to each campus for use by the network engineering community. In addition, one system was placed internally at the Pittock site so that testing could be done from an outlying campus to the Pittock building across a single SONET link. Our test topologies included:
1. Calibration tests. By this we mean tests where we primarily tested our hosts standalone sans a real network infrastructure deployment. These tests included localhost tests, host pairs separated by no switch, and host pairs separated by either a large or small ethernet switch. Switches tested included Cisco 5500 (large), and 3508G and 3524 (small). These tests gave us some feeling for standalone ethernet speeds and for delay caused by single switches.
2. Internal backbone tests. Two campuses (OGI and PSU) conducted a few tests that crossed over primarily gigabit ethernet backbones. These tests allowed us to look at the difficult world of real backbone usage and in general crossed at least several ethernet switches and/or routers. The tests involved bigger chassis-based Cisco Catalyst switches (5500s) paired with a smaller switch.
3. External tests. In these tests, we placed a host as close as possible to one of the campus border routers (although "as close as possible" often had to be governed by practical issues of ease of placement) and made measurements primarily from the outlying campuses to the Pittock building. We also ran several tests from one campus to another. These tests gave us an indication of delays cross campus and what problems might exist in our backbone to border router designs.
4. Miscellaneous host tests. We were not primarily interested in testing one operating system against other. However we did perform a few desultory tests with Solaris, Linux, and the Cisco IOS itself using TTCP. Results here had a tendency to produce unexpected results. See the section below entitled: "Things That Go Bump in the Night" for more details.
In section 2, test methodology, we primarily discuss how our tests were setup, although a few test results are presented. In the middle part of the paper, we present various test results, including section 3, calibration tests, section 4, backbone tests, section 5, MAN tests, and section 6, "things that go bump in the night". Finally, we present our conclusions in section 7.
2. Test Methodology
In this section, we will first discuss our two test tools, ping and ttcp. We also provide a short discussion of how our tests were setup and performed.
2.1 Ping and TTCP
Our tests are based on the FreeBSD ping [PING] [STEVENS94] program and the public domain ttcp tool [TTCP].
We wanted a ping that was flood ping capable, and had high temporal granularity in terms of its response. This in theory, would allow us to make reasonable measurements both in terms of high-speed gigabit ethernet connections, and over relatively fast paths across a few gigabit ethernet switches. Some pings do not have flood ping capabilities; for example, both WNT and Solaris pings lack that capability. Flood ping allows us to send a great number of packets in a very short time as this ping variation sends as many pings as possible with no per ping delay. Our goal here was to produce a short-term measurement with as many pings as possible, and indirectly test high-speed networking robustness as well as average ping delay. We felt that we could use ping as a rough substitute for various audio/video measurement purposes, as it would give some sense of how fast a video or audio stream could deliver packets across switches and routers. Of course, flood ping would also stress-test network components.
In our tests, we sent 10000 pings with various data packet sizes, typically 56, 250, 500, 1024, and 1460 bytes. The latter choice was made as we wanted to get a packet size more or less near MTU size for ethernet, but still avoid fragmentation. However we did make a few tests with 1500 bytes in the ping payload, which caused fragmentation. Another important aspect of ping of course is measurement time granularity; that is, how well can we measure the roundtrip, especially in the face of network devices that may very fast. We will return to the ping issue more below. However in summary, when we started testing, we felt that FreeBSD’s ping was the only acceptable choice.
Ttcp has a long history of use as a TCP test tool. In summary, it tests end host to end host TCP throughput, without involving hard disks on either end (as opposed to ftp which may be testing hard disk i/o as opposed to raw TCP network throughput). Ttcp's i/o transfer is thus from memory to memory.
We wanted a host network stack with an older TCP protocol implementation that had stood the test of time. We also wanted to use ttcp to test a certain set of TCP window sizes; for example, 16k, 32k, 64, and 128k windows. Again given the long history of the BSD stack [LEFFLER89] , we felt that FreeBSD hosts were a reasonable choice.
We present below a number of ping traces from various operating systems. In all cases, the ping host was pinging one of our stock BSD test hosts where there typically were a few layer 2 or layer 3 "hops" over ethernet connections.
First we have the Microsoft NT 4.0 trace:
Reply from 131.252.208.14: bytes=32 time<10ms TTL=254
Reply from 131.252.208.14: bytes=32 time<10ms TTL=254
NT’s ping simply does not bother to record any speeds less than 10 milliseconds. Given that our delays were often less than a millisecond, this was not deemed helpful.
Next, we turn to Sun Solaris 5.7,
sh-2.02$ ping -s jerry.cat.pdx.edu
18 bytes from jerry.cat.pdx.edu (131.252.208.14): icmp_seq=0. time=0. ms
18 bytes from jerry.cat.pdx.edu (131.252.208.14): icmp_seq=1. time=0. ms
...
----jerry.cat.pdx.edu PING Statistics----
14 packets transmitted, 14 packets received, 0% packet loss
round-trip (ms) min/avg/max = 0/0/0
Here we have a ping that presents summary min/avg/max stats but seems to claim that the connection to the remote host is arbitrarily fast. In truth, this ping cannot resolve anything less than a millisecond.
Next, we turn to redhat 6.2 linux (2.2.14-5):
# ping jerry.cat.pdx.edu
PING jerry.cat.pdx.edu (131.252.208.14) from 131.252.215.8 : 56(84) bytes of data. 64 bytes from jerry.cat.pdx.edu (131.252.208.14):
icmp_seq=0 ttl=254 time=0.3 ms 64 bytes from jerry.cat.pdx.edu (131.252.208.14):
icmp_seq=1 ttl=254 time=0.3 ms 64 bytes from jerry.cat.pdx.edu (131.252.208.14):
icmp_seq=2 ttl=254 time=0.4 ms --- jerry.cat.pdx.edu ping statistics (131.252.208.14):
...
6 packets transmitted, 6 packets received, 0% packet loss
round-trip min/avg/max = 0.3/0.3/0.4 ms
Here we at least admit that the roundtrip time was on the order of .3 milliseconds, but granularity is no better than a tenth of a millisecond.
On the other hand, here is a BSD test against the same remote host:
# ping jerry.cat.pdx.edu
PING jerry.cat.pdx.edu (131.252.208.14): 56 data bytes
64 bytes from 131.252.208.14: icmp_seq=0 ttl=253 time=2.247 ms
64 bytes from 131.252.208.14: icmp_seq=1 ttl=254 time=0.337 ms
--- jerry.cat.pdx.edu ping statistics ---
15 packets transmitted, 15 packets received, 0% packet loss
round-trip min/avg/max/stddev = 0.324/0.478/2.247/0.473 ms
Granularity here seems to be on the order of microseconds. The rough overall number is similar to the linux measurement (.3 seconds). BSD has the nice feature of producing a standard deviation. When we performed our tests, the BSD ping produced a better overall result.
The BSD ping code more or less does a gettimeofday(2) before a packet is sent, and then makes the same system call after the ping is returned, compares the new and old sec/microsecond timestamps and prints out a result. We decided to dig a little deeper, and created a small C test program that used the UNIX gettimeofday(2) system call, which reads out the time of day in seconds and microseconds. We made 100 gettimeofday calls in a tight loop, and then printed out the microsecond values returned. We performed this test on the Sun Solaris, Linux, and BSD systems. What we found was that the microsecond values on Solaris, Linux, and BSD suggested that better time granularity (between millisecond and microsecond) could be sampled on all three UNIX operating systems. In fact, Solaris and Linux samples showed that the microsecond value itself seemed to be obtainable at .000001 resolution. FreeBSD was on the order of 3-5 microseconds per call. We do not claim that this evidence is conclusive, but it certainly suggests that the BSD ping is accurate at .01 milliseconds, and that pings on other UNIX systems should at least be that accurate in terms of timing granularity. Unfortunately application programming may vary, and there appears to be little concern with some operating systems for high speed delay measurements.
2.2 Test Methodology
In general we used pairs of FreeBSD 4.0 and 4.1 hosts placed with 0 to N switches/routers between them. Please see figure 2 entitled Average Test Setup: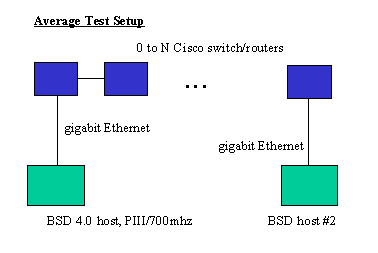
All hosts were equipped with Intel gigabit ethernet cards. These cards are known internally as WISEMAN cards and may be identified by the LSI chip on them (newer cards have replaced the LSI chip with an Intel chip). All cards have SX fiber connectors. In some cases, for so-called "calibration" tests, we performed the test over localhost on one host, or performed a "null switch" test over a single fiber pair between two directly connected hosts. Calibration tests were performed in isolation; i.e., no network traffic (barring spanning tree, and Cisco CDP packets) was present. We include single standalone switch tests in this test category. Network backbone tests were performed under real traffic loads and might include at least two switches, one of which was typically "central" in some way. External tests were done over the PREN network itself, which might or might not have traffic, although in general PREN traffic is lighter than our commodity Internet connections, but cannot be presumed to be non-existent.
Our basic test set is informally specified as follows:
1. topology specification: Define the equipment and connections in use. Specify what kinds of links are used (ethernet, SONET, etc.).
2. ping tests. Packet sizes include: 56 250 500 1024 1460.
The 1460 size was used to approximate the maximum MTU. We tried 1500 in a few cases. A 1500 byte ping payload will cause IP fragmentation. Therefore this was a fragmentation test with one large fragment followed by one small fragment.
The FreeBSD command for a ping test follows:
# ping -f -c 10000 -s <datasize> <ip-target>
The above ping command is a flood ping (-f) with a certain packet payload (-s) done 10000 times (-c ). Ping results placed in test tables below consist of the FreeBSD average per ping time, and a number called PPS that stands for pings per second. PPS equals 1000 milliseconds divided by the average ping time. For example, using a FreeBSD host, pinging localhost with -s 1460 10000 times, we obtain:
|
bufsize |
min |
avg |
max |
stddev |
pps |
|
1460 |
.019 |
.020 |
.068 |
.001 |
50000 |
FreeBSD ping reports the minimum time, the average time, the worst-case time, and a standard deviation at the close of a ping run. We divide 1000/.020 and get 50000 pings per second.
TTCP tests are more straightforward. We simply ran the measurement using window sizes of 16k, 32k, 64k, and 128k. We ran the test using a -f m format switch so that TTCP would print the result in megabits per second. We would rerun a test a certain number of times (say minimally 5 times) until we believed we had a best case number. Less optimal numbers occured, but our goal was not to measure any sort of average or determine how often TCP would behave in a sub-optimal fashion (although this could make a good study as well). Our ttcp tests should be regarded then as best case only. All ttcp measurements are in megabits per second (mbits). Typical ttcp test runs (first sender, then receiver) look as follows
(receive with 16k receive window) ttcp -f m -r -s -b 16384
(send) ttcp -f m -t -s <ip address>
We used tcpdump (http://www.tcpdump.org) to verify that the various TCP receiver window sizes between the BSD hosts were set by the ttcp command line option. This was indeed true for windows of size 16, 32, and 64k. We were hopeful that windows bigger than 64k might be allowed courtesy of new TCP options, but could see no evidence of that with the tcpdump network analyzer.
3. Calibration Tests
Our calibration (lab) tests consisted of testing FreeBSD in isolation in a lab environment. Tests were numbered according to major type and minor number. Calibration tests include the following:
c.1. localhost
c.2: no switch
c.3: one switch - Cisco 3508G ethernet switch
c.4: one switch - Cisco 3524XL ethernet switch
c.5: one switch - Cisco 5500 ethernet switch/router
Localhost means that ping and ttcp were run over localhost, 127.0.0.1, that is packets ran over the same host, and did not leave the box. We tested localhost with two different MTU sizes, the FreeBSD default for lo0 (16384), and 1500 bytes, which is analogous to the typical ethernet MTU. No switch means the BSD hosts were wired directly together sans ethernet switch. One switch means we added one gigabit ethernet switch, either small or large. Small switches include the 3508G (which has 8 gigabit ports), or the 3524 switch which has gigabit ports for uplinks, but in general has 24 100BASE ethernet ports. The 5500 is a large chassis-based switch, and we used gigabit port "blades. Barring localhost, all calibration tests here involve gigabit ethernet. No other link types were used.
All tests in this study may be considered relative to the localhost (c.1) or no switch (c2) tests, as they produced the fastest results. While it may be interesting to consider absolute speed, our goal was not to build the fastest possible host, but rather to start off with a fairly fast host (in terms of gigabit ethernet) and measure what happens when we add switches, routers, and WAN links to the mix. We suggest that c.1 (no switch, directly connected gigabit hosts) should probably be taken by the reader as the relative start point for comparison of all later results. The difference between localhost and no switch is simply the addition of drivers and real ethernet hardware. However the reader may choose either test as basis for comparison.
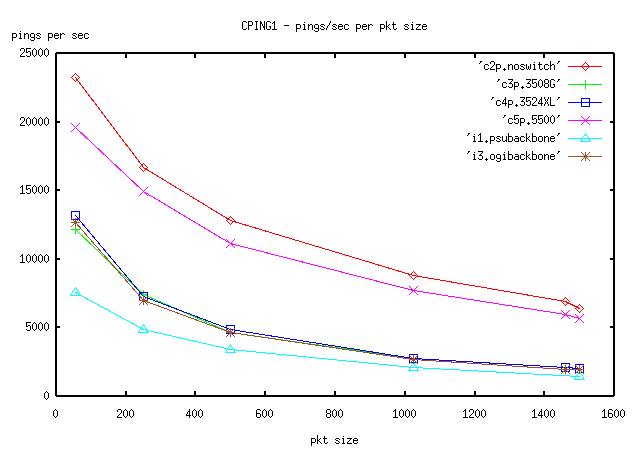
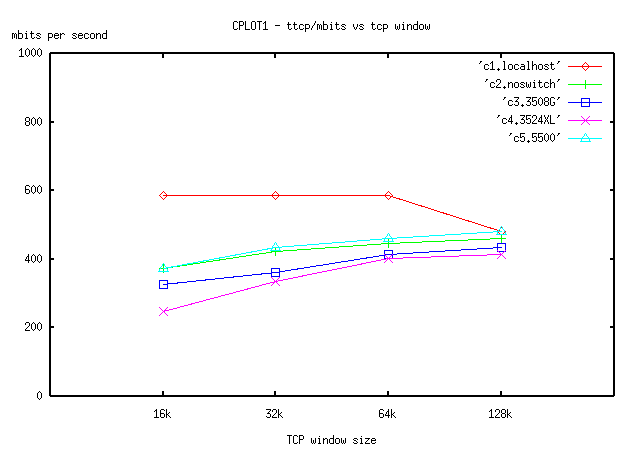
Calibration results are given below in tables and in 2 plot figures, figure CPING1, and CPLOT1. Ping tests are shown in CPING1. We also include two backbone (two switch) tests from section 4, and left out localhost as it flattened the graphs. CPLOT1 includes all ttcp measurements.
Calibration Test Tables
c.1. localhost (note 1500 MTU and 16k MTU ttcp rows)
|
ping/size |
56 |
250 |
500 |
1024 |
1460 |
1500 |
|
ping/avg |
.011 |
.014 |
.015 |
.018 |
.020 |
.021 |
|
ping/pps |
90909 |
71428 |
66666 |
55555 |
50000 |
47619 |
|
ttcp/window |
16k |
32k |
64k |
128k |
|
|
|
ttcp/mbits |
587 |
586 |
586 |
480 |
|
1500MTU |
|
ttcp/mbits |
1302 |
1260 |
1276 |
1274 |
|
16k MTU |
c.2.noswitch
|
ping/size |
56 |
250 |
500 |
1024 |
1460 |
1500 |
|
ping/avg |
.043 |
.060 |
.078 |
.114 |
.145 |
.157 |
|
ping/pps |
23255 |
16666 |
12820 |
8771 |
6896 |
6369 |
|
ttcp/window |
16k |
32k |
64k |
128k |
|
|
|
ttcp/mbits |
372 |
422 |
445 |
459 |
|
1500MTU |
c.3. single small switch, Cisco 3508G
|
ping/size |
56 |
250 |
500 |
1024 |
1460 |
1500 |
|
ping/avg |
.082 |
.135 |
.214 |
.359 |
.485 |
NODATA |
|
ping/pps |
12195 |
7407 |
4672 |
2785 |
2061 |
NODATA |
|
ttcp/window |
16k |
32k |
64k |
128k |
|
|
|
ttcp/mbits |
325 |
360 |
415 |
434 |
|
1500MTU |
c.4. single small switch, Cisco 3524XL
|
ping/size |
56 |
250 |
500 |
1024 |
1460 |
1500 |
|
ping/avg |
.076 |
.136 |
.206 |
.359 |
.486 |
.496 |
|
ping/pps |
13157 |
7299 |
4854 |
2786 |
2057 |
2016 |
|
ttcp/window |
16k |
32k |
64k |
128k |
|
|
|
ttcp/mbits |
247 |
335 |
401 |
413 |
|
1500MTU |
c.5. single large chassis switch/router, Cisco 5500 (no routing function here)
|
ping/size |
56 |
250 |
500 |
1024 |
1460 |
1500 |
|
ping/avg |
.051 |
.067 |
.090 |
.130 |
.167 |
.177 |
|
ping/pps |
19607 |
14925 |
11111 |
7692 |
5988 |
5650 |
|
ttcp/window |
16k |
32k |
64k |
128k |
|
|
|
ttcp/mbits |
373 |
434 |
459 |
482 |
|
1500MTU |
3.1 Discussion
Regarding ping:
1. Compare the 5500 (c5) to the no switch test (c2). The large Cisco Catalyst switch (5500) seems to provide a good approximation of "line-speed" when compared with no switch at all as it clearly is not adding much additional delay into the round trip times for the various sized buffers.
2. However the two smaller switches (3508G and 3524) definitely cause additional delay. Furthermore, the curves formed over the different buffer sizes are basically the same at all packet sizes; that is, we may assume the same compute engine. One other way to look at this is that with no switch, we basically have a 4 to 1 ratio between the number of packets sent at 56 bytes and the number of 1460 byte packets. With the two small switches, this ratio is 6 to 1, and with the big switch it is 4 to 1 again. Localhost on the other hand has a much better ratio, roughly 2 to 1. Although we are jumping ahead to backbone tests, the i3 OGI backbone test shows a curve clearly the same as the 3508 and/or 3524 switches by themselves. The OGI backbone test consisted of a 5500 catalyst and a 3524 switch. Clearly the 3524 switch was the limiting factor in terms of delay in that test. We may therefore suggest that small switches in a signal path will add additional delay and this should be considered important in the construction of high-speed networks or networks focused on two-way video conferencing.
3. As a minor matter, there does not seem to be much throughput lost due to fragmentation. Compare the few instances of 1500 to 1460 in terms of average delay. In general, fragmentation doesn't seem to hurt that match, at least when looked at in terms of delay.
Regarding TTCP tests:
1. It is interesting that with the large 16k localhost MTU we basically achieve about 2X TTCP performance when compared with the 1500 byte MTU, both over localhost. The 1500 MTU size for localhost suggests a 600mbit upper bound on any test over ethernet. The 16k MTU rather strongly suggests that larger MTUs are good for output, presumably because of bus/byte-copy factors per i/o transaction.
2. Please refer to the CPLOT figure, localhost itself seems to be immune to window size changes, and for some reason, 128k windows are not a good idea.
3. Again the 5500 switch seems to be a reasonable approximation to no switch at all.
4. Although it is not true in every case, and any rash assumption here might be debatable, the graphs seem to suggest that the improvement from 16k to 32k is more dramatic than say from 32k to 64k. For example, with the 5500 switch, we obtained 373 mbits with 16k windows. With 64k windows, we get 434 mbits, so we gained approximately 60mbits throughput. However from 32k to 64k we only get 25mbits of improvement. On the other hand, barring localhost, all systems show some improvement from 16k to larger windows.
4. Backbone Tests
In this section, we look at two backbone tests, known internally as:
i.1: PSU backbone test
i.3: OGI backbone test.
These tests repeated our previous ping and ttcp runs over an approximation of the two campus backbones. Both campus backbones are roughly similar with two or more Cisco Catalyst 5500 switch/routers with RSM (route switch module) router cards in the center, and typical outlying smaller switches (although sometimes the outlying switches are not smaller and may be larger switches as well). The typical switch to switch connection at this point is gigabit ethernet. Thus what we tested as a result can be boiled down to all gigabit ethernet links coupled with 2 switches in the center. To be clear, there was no inter-campus traffic here, only intra-campus traffic.
The topology of the i.1 PSU backbone test consisted of a 3508G small Cisco gigabit switch connected to a Catalyst 5500 switch. However an important difference here between this test and the OGI test was that the PSU 5500 transition included a layer 3 routing transition. Thus the 5500 in question added a Cisco Route Switch Module (RSM), which has the compute engine of a Cisco 4700 router. Put another way, the two hosts were on different IP subnets.
The OGI topology was a strict layer 2 transition using a VLAN. OGI's test consisted of two switches "in series": a Cisco 5500 and 3524XL. Note that we tested the two small switches (3508 and 3524) by themselves in the previous section.
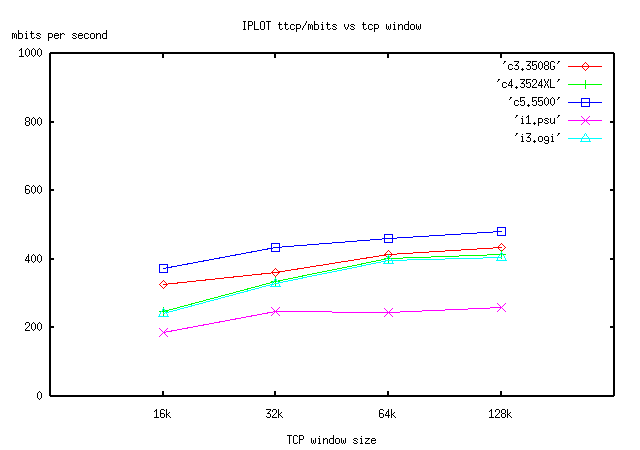
Please refer to the following tables and figures including figure CPING1 (given in the previous section), which includes both single and double switch ping data, and figure IPLOT, which includes ttcp data for these two tests and also for reference, includes the 3 previous single switch tests.
i.1.PSU 3508G/5500-RSM
|
ping/size |
56 |
250 |
500 |
1024 |
1460 |
1500 |
|
ping/avg |
.132 |
.205 |
.293 |
.485 |
NODATA |
.680 |
|
ping/pps |
7575 |
4878 |
3412 |
2061 |
NODATA |
1470 |
|
ttcp/window |
16k |
32k |
64k |
128k |
|
|
|
ttcp/mbits |
185 |
247 |
243 |
258 |
|
1500MTU |
i.3. OGI 3524XL/5500
|
ping/size |
56 |
250 |
500 |
1024 |
1460 |
1500 |
|
ping/avg |
.079 |
.143 |
.216 |
.376 |
.506 |
.520 |
|
ping/pps |
12658 |
6993 |
4630 |
2660 |
1976 |
1923 |
|
ttcp/window |
16k |
32k |
64k |
128k |
|
|
|
ttcp/mbits |
240 |
328 |
397 |
406 |
|
1500MTU |
4.1 Discussion
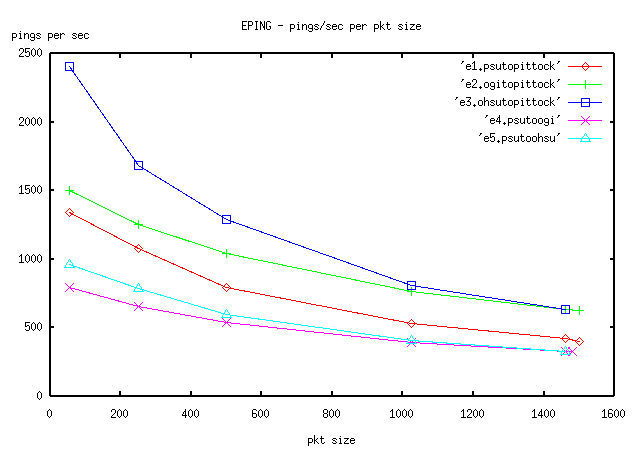
Regarding ping delays (please look at figure CPING1), there is further evidence here that the Catalyst 5500 switch is closer to the ideal of no switch. All single switches and the OGI backbone which consists of a paired layer 2 3524XL and 5500 switches are lumped together in one line, and the 5500 graph itself is close (but not quite the same) as the no switch test set. On the other hand, the PSU test adds layer 3 (in terms of the Catalyst RSM "router on a board") to the mix. There is real cost as a result.
If we turn and look at ttcp tests (figure IPLOT), again the OGI paired set (5500/3524) approximate the slower switch. PSU speeds more or less bottom out at 240mbits or so with windows above 32K. The PSU curve itself suggests the 16k to 32k window transition, which shows about a 33% improvement, is proportionally a bigger improvement compared to other window size transitions. Keep in mind that this test represents "real conditions" and was not done in a lab environment.
The PSU backbone tests had some rather interesting and important lessons. First of all, we made some mistakes in setup of the combined l2/l3 device. Our first 16k ttcp run resulted in throughput of 100mbits, which was rather shocking given that the 3508G by itself was showing 325 mbits. How did we lose 200 mbits? It turned out that we had misconfigured the RSM/Catalyst switch itself, and failed to enable Cisco's Multi Layer Switching (MLS). MLS maps an ip destination to a layer 2 port, resulting in a far faster flow through the layer2/layer3 combination device. We also had forgotten that a complex Access Control List (ACL) was deployed in the router to protect the rest of PSU from any problems in the networking lab. Turning the ACL off and MLS on resulted in further improvement. There are two important lessons here: 1. basic configuration mistakes can have very harmful results on high-speed networking. 2. Access Control Lists may be presumed to be a very basic enemy of high-speed, long distance networking.
There is a serious conundrum here. Network security experts believe that basic ACL mechanisms are necessary to provide protection against various forms of IP spoofing attacks [FERGUSON98]. On the other hand, we spoke to Steve Corbato about his Internet2, high speed HDTV video tests over the Abilene backbone. Dr. Corbato stated that his basic rule was that all ACLs must be off. Our PSU backbone test suggests that a router like the Catalyst 4700/RSM does not have enough compute power to deal with gigabit ethernet and does less well when ACLs are imposed.
Jumping ahead to the next section, when we tested OGI's OC-3 connection we obtained approximately 122 mbits or so out of 155 possible with OC-3 SONET. We put a test set of ACLs in the router, reran our tests, and saw little overall performance degradation. One router or combination l2/l3 system may have different results when compared with another. However all we really know is that the ACLs and the OGI 7500 router can deal with 155 mbits. What if OGI had a gigabit ethernet connection to the central Pittock location?
Researchers should keep in mind that internal gigabit ethernet MAN connections may exist now or in the near future, and that Wave Division Multiplexing, and/or 10 gigabit ethernet are fast approach We suggest this is a permanent and important conundrum and the tradeoff between speed and security is an open question. Imposing even simple security mechanisms like ACL-based ingress/egress filters may have serious impacts on speed. Networks do not get simpler, hence ACLs may grow and become more complex. Without testing efforts, network engineers may not know if they are under utilizing costly MAN and WAN high-speed connection links.
5. MAN tests
In this section, we are going to present four external test cases that crossed the Portland PREN man over its three OC-3 links. We are going to neglect the exact details of the topologies and present topologies in a summary form. The tests consist of the following:
e.1. PSU to Pittock. Packets crossed two internal PSU routers and one set of small switches to reach the OC3 link to Pittock. At the Pittock hub center, packets crossed over the Cisco GSR 12000 router, and a small 3508G switch to the end host. Note that OGI and OHSU paths within Pittock are the same as the PSU path. PSU had a total of 5 units of Cisco infrastructure gear, BSD host to BSD host.
e.2. OGI to Pittock, OGI's path to the OC3 link consisted of a large Catalyst 5500 switch, followed by their 7500 border router. OGI and OHSU both had a total of 4 units of Cisco infrastructure gear, BSD host to BSD host.
e.3. OHSU to Pittock, OHSU's path to the OC3 PREN link consisted of a small switch, followed by a 7204 border router.
e.5. PSU to OHSU, in this test there were 6 total units of Cisco infrastructure gear. This test crosses the MAN, end to end and is representative of all possible MAN tests; for example, OGI to PSU, etc.
Please see the following tables, and figures EPING for ping graphs, and EPLOT, for ttcp data.
e.1, psu/pittock
|
ping/size |
56 |
250 |
500 |
1024 |
1460 |
1500 |
|
ping/avg |
.745 |
.929 |
1.260 |
1.892 |
2.374 |
2.490 |
|
ping/pps |
1342 |
1076 |
793 |
528 |
421 |
401 |
|
ttcp/window |
16k |
32k |
64k |
128k |
|
|
|
ttcp/mbits |
71 |
82 |
82 |
84 |
|
1500MTU |
e.2 ogi/pittock
|
ping/size |
56 |
250 |
500 |
1024 |
1460 |
1500 |
|
ping/avg |
.667 |
.796 |
.961 |
1.305 |
1.570 |
1.590 |
|
ping/pps |
1499 |
1256 |
1041 |
766 |
636 |
628 |
|
ttcp/window |
16k |
32k |
64k |
128k |
|
|
|
ttcp/mbits |
93 |
122 |
122 |
122 |
|
1500MTU |
e.3 ohsu/pittock
|
ping/size |
56 |
250 |
500 |
1024 |
1460 |
1500 |
|
ping/avg |
.415 |
.593 |
.777 |
1.239 |
1.580 |
NODATA |
|
ping/pps |
2409 |
1686 |
1287 |
807 |
632 |
NODATA |
|
ttcp/window |
16k |
32k |
64k |
128k |
|
|
|
ttcp/mbits |
78 |
79 |
82 |
83 |
|
1500MTU |
e.5 psu/ohsu
|
ping/size |
56 |
250 |
500 |
1024 |
1460 |
1500 |
|
ping/avg |
1.043 |
1.268 |
1.684 |
2.437 |
3.084 |
NODATA |
|
ping/pps |
958 |
788 |
593 |
410 |
324 |
NODATA |
|
ttcp/window |
16k |
32k |
64k |
128k |
|
|
|
ttcp/mbits |
54 |
77 |
80 |
80 |
|
1500MTU |
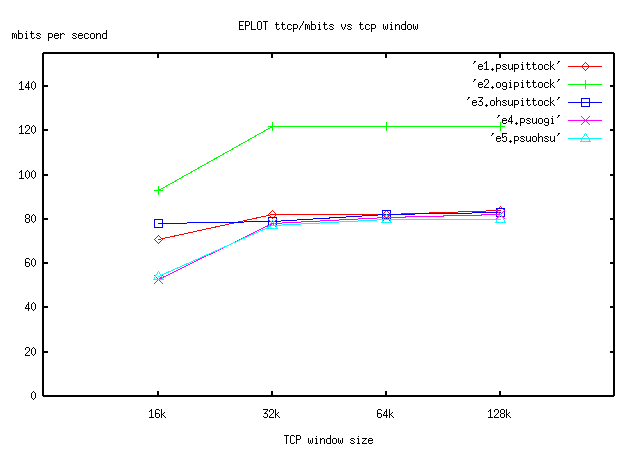
5.1 Discussion
So why with the best ttcp measurement does OGI obtain 122 megabits, but PSU and OHSU only get around 80mbits?. The good news is in fact that OGI managed to use most of its OC-3 for a single flow. [Miller97] suggests 6% overhead for SONET. [Stevens, pp. 354] more or less suggests TCP could use 90% of the link speed. There may be other sources of overhead and/or delay as well including layer 3 routing transitions. We suspect the limiting element in the OGI connection is the 7500 router with its RSP4 CPU card (as opposed to the Cisco GSR 12000). This explains OGI's approximate 80% usage of the pipe. PSU and OHSU as it turns out both have 100BASE ethernet links in the path to the border routers. PSU recently spent over 1 million dollars upgrading most of the campus backbone from older 100BASE ethernet switches and FDDI cross-connects to 1000BASE ethernet switch interconnects with 100BASE downstream ports to most hosts. Unfortunately there was not enough money to upgrade the last internal ethernet connections to the border routers or the border routers themselves. The PSU backbone consists of four routers, two to the outside, and two to the inside. All four routers are redundantly connected with small paired ethernet switches. In summary, gigabit ethernet exists for many important PSU switch interconnects, but paired 100mbit ethernet connections are all that were available to the external border routers. In theory, PSU can use aggregation techniques to serve up more than 100mbits (200mbits total) to the OC-3, but no single host can get more than 100mbits in a flow. OHSU has similar constraints. Both universities hope to reach their current OC-3 links with more bits in the next year as budgets allow.
In figure EPLOT, notice that with 4 out of 5 ttcp tests we seem to see the knee result again that was previously mentioned in section 4.1. There is marked improvement between the 16k and 32k windows when compared with bigger window improvements (32k to 64k, etc.).
As an adventure in speculation, please consider the following table taken from some of the previous tests:
| |
ping/MTU |
ttcp/32k |
loss (%) |
l2/l3 hops |
|
1. localhost |
.020ms |
586mbits |
0 |
0/0 |
|
2. no switch |
.145 |
422 |
28% |
0/0 |
|
3. 3508G |
.485 |
360 |
39% |
1/0 |
|
4. 3508G/5500-RSM |
.680 |
247 |
58% |
2/1 |
|
5. OC-3/OGI/Pittock |
1.57 |
122 |
80% |
2/2 |
Here we attempt to cross-correlate some results from all of the major test sections. The second column gives the delay per ping at 1460 bytes. This can be considered as an approximation of the sort of round-trip delay that TCP itself would have to deal with assuming large packet sizes. In the third column, we see the ttcp measurement at the 32k window size, which has seemed reasonably optimal with FreeBSD. In the fourth column, we calculate a relative percentage loss or degradation in TCP throughput based on the difference between a given test, and the localhost numbers. In the last column, we show layer 2 and layer 3 transitions in the test. Note that rows 2, 3, and 4 have all gigabit ethernet links. Note that row 5 is constrained by the OC-3 155mbit SONET link. What might we learn from this table?
For one thing, short-haul gigabit TCP seems to be sensitive to delay. Consider that a short path is very fast, and initial delays are very small. Perhaps traditional bandwidth-delay thinking applies here because delays are very significant. The localhost to null switch transition adds 4 interface hw/sw transitions and operating system interrupts to localhost. Probably memory copies are a principal source of delay here, from the operating system to interface hardware. If we add even a single small switch, we have lost 40% of our initial throughput potential. It may be fair to say that local delays take a large chunk out of TCP's potential. It would be very interesting to replace the SONET/OC-3 link (which does seem to be constraining TCP at least in terms of the OGI tests) with a gigabit ethernet link and then measure the result. On the other hand, note that TCP didn't really show that much slowdown with 32k windows between the (e.3) OHSU to Pittock, and (e.5) PSU to OHSU links. This is perhaps not news, but it is comforting to notice that different delays (which are longer delays) did not seem to change the result appreciably.
6. Things That Go Bump In The Night
In this section we are briefly going to review some miscellaneous tests, some of which were host oriented and involved non-BSD operating systems. One of the more interesting aspects of the entire test experience were "unexpected occurrences". For example, we have already mentioned ping failures with other operating systems, and PSU's backbone test mistakes. Some tests in this section may lead to further testing. For example, PSU plans on comparing later versions of redhat linux to FreeBSD with various gigabit ethernet cards.
1. Switch Crashes
We discovered that at times we could crash one small Cisco 3524XL switch with the ping 1500 ping flood tests. This was only possible if the test BSD hosts were directly connected to the switch. Apparently something untoward resulted with strict alternation of large MTU packets followed immediately by a single fragment. Cisco has been notified, but the bug was not yet resolved (we suspect a single instance of hardware failure).
2. Cisco TTCP
In newer versions of Cisco IOS, the TTCP command is provided as a command-line function. We tested Cisco TTCP from the OGI border router to the Cisco GSR 12000 in Pittock. This test involved only two directly connected Cisco routers. Our best numbers were 101 mbits with a 64k TCP window. This result can be compared with the e.2 OGI to Pittock test in the previous section. In that test we added BSD hosts, and internal switching gear on both sides. The 64k result there was on the order of 122 mbits. Users of the Cisco TTCP command should be aware that their results may be sub-optimal. To be fair to Cisco, it is not reasonable to expect boxes that are optimized for layer 3 processing to be good end hosts.
3. Linux redhat 6.2
In the PSU lab we hooked up a linux redhat 6.2 system to our FreeBSD 4.1 system for internal testing. We placed the Cisco 3508G gigabit switch between the hosts and ran our TTCP tests. Again, we were using the Intel gigabit ethernet cards (WISEMAN). The host hardware in both cases was the same. All four TTCP tests [16k, 32k, 64k, 128k] with different window sizes got exactly the same result, 140mbits. This is, of course, inferior to the BSD result (see the calibration test, c.3) which had 325 mbits at 16k windows. We did not pursue finding out why linux performance was inferior as well as peculiar (it did not respond to window-size changes). For future work, we intend to pursue testing of later versions of linux and compare it to the FreeBSD operating system. It is our belief that researchers performing comparison tests using Linux with high-speed networks and TCP, should exercise extreme caution.
4. Solaris 8
A Sun Sparc running Solaris 8 was hooked up over a Catalyst 5500 switch to a BSD box using the Intel WISEMAN gigabit card. The Solaris box used the syskonnect gigabit ethernet card. Our test runs showed that out of the box the Solaris system reduced TCP throughput to 18k with 16k windows. All other TTCP window sizes resulted in the same 249 mbit result. We apologize for reporting such a bizarre test result as we do not have time to investigate further. Readers may make of this what they will.
7. Conclusions
We believe we met our goals in this study. We measured single host to host end delays and TCP throughput on both our MAN, with single switches, and across two campus backbones. Due to this study, network engineers at PSU and OHSU have initiated budget measures in the hopes that the final stages of the campus networks can be re-engineered to take full per flow advantage of the OC-3 links.
We present here a few important conclusions:
1. ACL lists in routers may impede high speed networking. At PSU, we found that even though we may have a gigabit ethernet internal backbone, ACLs in our Cisco Catalyst 5500/RSM limit throughput to less than 200mbits. OGI found that their 7500 border router did not limit bandwidth across an OC-3 SONET link appreciably. However, this does not prove that the 7500 CPU/backplane would scale to gigabit speeds. ACL mechanisms are apt to be more efficient at layer 3 than proxy/application filtering at layer 7, and can be moved into hardware. Thus this problem can be solved at more expense. Even so, hardware solutions will have limits; for example, the number of ACL rules may have an upper bound.
2. We believe we have observed several behavioral differences in TCP that depend on very short delays (see CPLOT and IPLOT figures). Over very short delay situations (1 to 2 switches) delay may be small, but it may cause large loss in throughput.. However once we get to the MAN or WAN, the MAN, this phenomenon no longer applies. As a more minor matter, the 16k to 32k window improvement phenomenon is interesting. 32k to 64k windows do not seem to show as much improvement. Suggesting minimal 32k windows with BSD hosts seems reasonable.
3. OHSU and PSU do not have reasonable paths that can potentially use all of their OC3 bandwidth in a single flow. PSU at least, has aggregation capabilities in that regard. Both universities are considering backbone upgrades to improve internal to external connectivity.
4. Ping on many operating systems does not have enough internal time resolution to be useful in a high-speed network at least in terms of timer granularity. Of course, it can still tell you if you are connected. BSD ping (and the latest linux ping) is far superior to other pings.
5. We suggest that using flood pings to characterize and compare the behavior of switches and routers with various sized packets is an idea that should be considered more widely. We found it useful that we could show that a Cisco Catalyst 5500 switch was more or less operating at the same speed as "no switch" and that smaller switches cause a performance penalty.
8. Acknowledgements
We would like to thank Dave Burns and Jon Snyder of PSU, and Bill Kelly of OHSU, for their assistance and suggestions. We would also like to thank Matthew Jacobs for developing the FreeBSD WISEMAN driver, and Kristen Carlson of Intel for helping us out with both cards and driver support.
9. Bibliography
[FERGUSON98] Ferguson, P., Senie, D., "Network Ingress Filtering: Defeating Denial of Service Attacks which employ IP Source Address Spoofing, RFC 2267, January 1998
.
[LEFFLER89] Leffler, et. al., The Design and Implementation of the 4.3BSD Unix Operating System, Addison-Wesley, 1989
[MILLER97] Miller, Gregory., Thompson, Kevin, and Wilder, Rick.., Wide-Area Internet Traffic Patterns and Characteristics. IEEE Network, Nov/Dec 1997.
[PREN]
http://www.pren.net/
[PING]
http://ftp.arl.army.mil/~mike/ping.html
[STEVENS94] Stevens, Richard W., TCP/IP Illustrated, Volume 1, chapter 7, 1994, Prentice-Hall, pp.85-90
[TTCP]
http://ftp.arl.mil/~mike/ttcp.html