So you want to get an "A"? Or maybe you are worried about getting a "D"?
In this document I explain how I compute grades and why it is hard for me to predict your grade before the end of the quarter. This information applies only to my classes. It is not the grading policy used by all faculty, although you will find that several other members of the faculty use similar methods.
Here is an outline of this document:
A curve implements a relative grading system. When a curve is used, there is no fixed score that earns an "A", "B", etc. Instead, the letter grade is an expression of how well any one student performs relative to the rest of the class. Strict use of a curve can cause problems if the absolute standards of performance vary from course to course. A curve can also create a feeling of unfair competition because it restricts the number of good grades to only a small number of students.
I have tried to move away from relying on a curve. For courses that I have taught several times, I have a good idea of what I expect of students, and for those courses I use an absolute grading criterion. For new courses -- and I'm still creating new courses -- I use a curve to establish the level of performance that is acceptable, ie., what is passing.
The following table summarizes the meaning of letter grades. The table is taken directly from the PSU Bulletin (See "Grading System for Undergraduates", p. 26 in the 2000-2001 Bulletin)
| Grade | Meaning | ||
|---|---|---|---|
| A | Excellent | ||
| B | Superior | ||
| C | Average | ||
| D | Inferior | ||
| F | Failure |
The use of +/- modifiers allows for increments between the whole letter grades in the table.
Note that average performance earns a grade of "C".
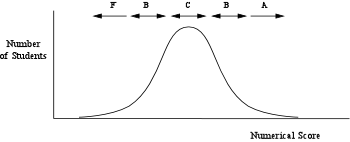
Underlying the process of grading on a curve is the assumption that the performance of students in the class follows a reasonably well-behaved statistical distribution. The usual model is to assume that the distribution is "normal" (i.e. Gaussian) so that the grade distribution looks like the following.
The diagram illustrates several important assumptions about the grading model:
I assign letter grades only at the end of the quarter. The letter grade is based on a cumulative score computed from a weighted average of homework, exam, and project scores. Consider the following data for a hypothetical student "X".
| Maximum | Score of | ||||||
|---|---|---|---|---|---|---|---|
| Category | Weight | Possible Score | Student "X" | ||||
| Homework | 15 % | 250 | 207 | ||||
| Midterm | 30 % | 110 | 88 | ||||
| Project | 25 % | 90 | 75 | ||||
| Final Exam | 30 % | 125 | 94 | ||||
The weights express the relative importance of the evaluation (test, homework, etc.) in computing a cumulative score for the course. The maximum possible score varies from category to category for convenience of assigning grades on individual assignments. The maximum possible score does not really matter because the relative score, (your score)/(max possible score), is used to compute your cumulative grade.
Using the data from the table, the cumulative score of student "X" for this course is
0.15 × (207/250) + 0.30 × (88/110) + 0.25 × (75/90) + 0.30 × (94/125) = 0.798
So, student "X" gets a cumulative score of 80 % (rounded to two digits). Surely that is a "B", right?
The correct answer is, "It depends". When the final letter grade is based on a curve; a cumulative score means nothing all by itself . The letter grade corresponding to a cumulative score of 80 % depends on the cumulative scores of all other students in the class.
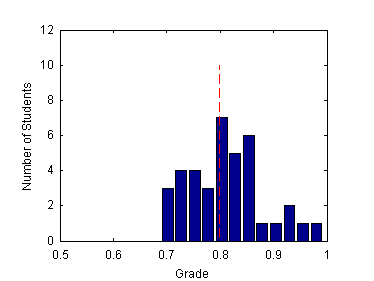
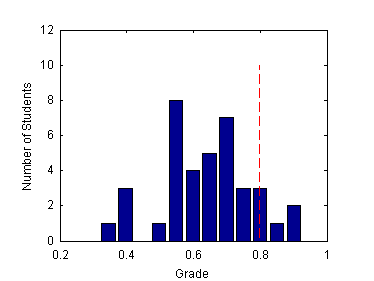
Below are histograms of two hypothetical cumulative score distributions for a class with 38 students. In both cases the dashed vertical line indicates the cumulative score of 0.798.
 |
Score of 0.8 is just above average. Student X probably gets a "C". | |
 |
Score of 0.8 is above average. Student X probably gets a "B+" or "A-". |
I believe that assigning grades should be done as objectively as possible. I believe that grades should measure a student's performance in a class and nothing more. A perfectly competent student might get a low letter grade if he or she did not perform well. The letter grade is measure of how well a student meets the objectives of a particular class taught during a particular academic term. It does not indicate whether the student will be a good engineer. Of course, a student who consistently gets low letter grades might well consider a different career.
To help make assigning letter grades objective, I have automated as much of the grading process as possible. Scores for each homework assignment and each exam and project are recorded in a spreadsheet. The weighted cumulative score for each student is computed using the procedure outlined above. At the end of the quarter I create a histogram of the cumulative scores. I fiddle with the bin widths on the histogram to see if I can cause natural breaks between letter grades to emerge. I then decide where the breaks between letter grades should be. I enter those break-points into my spreadsheet, and the spreadsheet automatically assigns letter grades.
Up to this point I have been a grading machine. With a well-defined algorithm I compute the cumulative scores, and without knowledge of individual student performance, I assign the break-points. After that, the hard part begins.
To make a final determination of each student's grade, I print out the spreadsheet and review the scores, one student at a time. I look at such things as relative improvement during the quarter, and whether or not a single bad performance (a bad exam, an unlucky affiliation on a group project) might have made a inordinately large contribution to the cumulative score. If so, and if it seems fair to all the rest of the students in the class, I make a slight adjustment (up or down) to the letter grade assigned by the spreadsheet.
If a student with a low cumulative score gets one of the highest scores on the final exam, I might give that student an "A". In other words, if you "ace" the final exam, you will probably get and "A". Don't fool yourself, however. I have yet to have a student with an otherwise low cumulative score get an "A" solely on the basis of an outstanding final exam. Students who ace the final exam have usually been doing well all quarter long.
The tedious process of assigning grades can not be completed until I have all of the grading data. That means I cannot tell you what your grade is going to be until all the scores have been assembled into a cumulative score. You can make a rough estimate of your grade by comparing your score on the exams and projects to the average scores for each of those grading categories. If you do so, be sure to include the weights given on the syllabus for the class. The weights given above are typical, but are not guaranteed to be those used for any one particular class.
If you have read this far, then you will probably realize that it is not easy to get an "A". This is as it should be, because we do not live in Lake Wobegon, "where all of the children are above average".
The obvious way to get an "A" is to score well above average on each of the class assignments. This requires discipline and a lot of hard work. I will do my best to help you be successful, but in the end, I am just a grading machine. You determine your own grade. Good luck!
| Back to Gerry's classes | Back to Table of Contents | Gerry's home page |