
| Language Level: | Intermediate Student |
| Teachpacks: | image.ss |
The homework involves linear regression. The problem is well-suited to being decomposed into a set of related functions, as you will discover for yourself.
Work with a partner, or alone: your choice. If you work with a partner, be sure to Sit Together.
Read Sections 19 thru 21.3 from HTDP. The crib sheet in Figure 57 will be useful. (Note that the figure in the printed version of HTDP has some typos.)
Download this file, and save to your Scheme directory under as new file name (the name of you and your partner). We have discovered (the hard way) that on Windows Vista, it is dangerous to save a file to your downloads directory and then run DrScheme on it. The file contains some data on which you will run your functions, and parts of some data definitions and templates to get you started.
You will need three data definitions in order to do this homework: datum, dataset and linear-eqn (for "linear equation"). A datum will consist simply of an x and a y. A dataset will consist of a nonempty list of datums. A linear-eqn will consist of a slope and a y-intercept (the coefficients m and b from the familiar linear equation form y = mx + b).
A linear regression analysis is applied to a set of data; its result is the line that mathematically best fits the data as it would appear on a two-dimensional plot. Operationally, with linear regression analysis, you put a dataset in and get a linear equation out. Your task is to provide a function linear-eqn-fitting whose contract is
;; linear-eqn-fitting: dataset -> linear-eqn
In the following discussion, assume that n is the number of datums in the given dataset.
The best-fit slope for the linear model of a set of data is given by
The y-intercept for the linear model of a set of data is given by

These two formulae can be represented as Scheme functions with the following contracts:
;; slope: dataset -> num ;; intercept: dataset -> numAs you develop these functions, you will find that you will want to use local definitions and helper functions. The helper functions you will need to write in order to get linear-eqn-fitting to work will mostly be list-processing functions that operate on datasets. It is up to you whether you write structurally recursive functions that follow the How to Design Programs template, or whether you use Scheme's built-in abstract functions for list processing. Either way, be sure you surround all your functions by contracts, purposes, and tests, as always.
The second part of this homework is a visualization of linear regression. You will write a function
;; linreg-image: dataset -> image
Your visual representation of linear regression analysis must include, at a minimum,
You may break this problem into smaller pieces as you see fit. Here is a skeleton of my own implementation:
axes: num -> image that returns an image of bare x- and
y-axes.
plot-point: datum image -> image where the second input
to the function is the background onto which to plot a given point
plot-dataset: dataset image -> image which plots a
dataset onto the background specified in the function's second input
(this can be neatly implemented as a fold)
plot-linear-eqn: linear-eqn image -> image, which draws a line representing the given linear-eqn on the background of the given image
linear-eqn->string: lineq -> string (you will need to use the built-in functions number->string and string-append for this)
truncate-decimal: number number -> number, which truncates the first argument to the number of deciamal places given in the second argument. (I used round, *, / and expt (exponention) for this.)
caption: string
image -> image
which produces the input image with the given
string as a caption below it (use text from the image.ss teachpack for this).
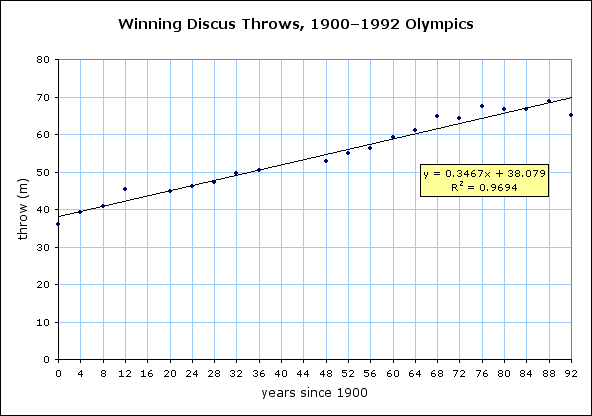
Pull all the pieces together. You should have been writing tests of the pieces as you developed them; now make sure that there are tests for the whole program. There is no good way to test the graphical part, but do make sure that when I click run in the definitions window, the code runs and produces a diagram similar to this one:
If you didn't manage to do all the parts, hand in what you did complete. For example, a set of axes with a regression line but no points is still good for partial credit. Parts I and II are independent: if you never managed to get linear-eqn-fitting working correctly, fake it! Dummy up a function that returns
(make-linear-eqn 0.3 38)
regardless of its input, and carry on with Part II.
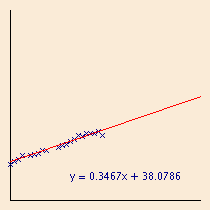
If you have time on your hands, you can get really fancy, as shown here:
This is more than I'm expecting, but it should give you some ideas. You may not have time to do anything this elaborate, but you should see that the detail is a "mere matter of programming" and that you could get there if you had the time and inclination. R2 is a measure of how closely the line fits the data:
| R = |
Put your names as a comment at the top of the definitions window. Save your file from DrScheme, attach it to an email message. In addition, put the names of both partners (or say that you din't use a partner) in the body of the email and in the name of the file. Submit your email to CS199Homework.
This homework is based on a lab used in the University of Chicago's CS105 Class, originally designed by Adam Shaw. The data were obtained from http://exploringdata.cqu.edu.au/oly_gold.htm